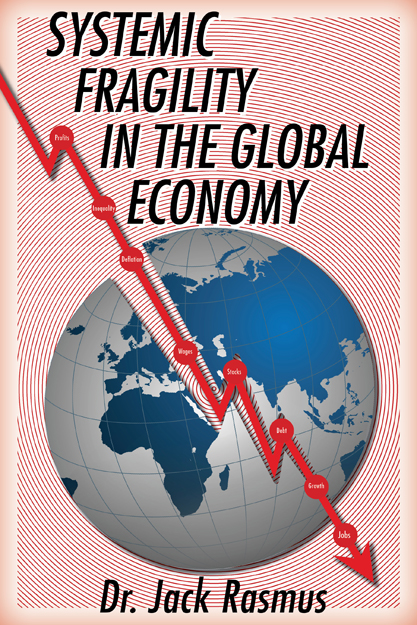
Trump brags how great the economy is doing and that American workers never had it so good, in terms of both jobs and pay. But the US government’s own data shows that since 2007 both jobs and wages for the working class have barely grown, forcing millions to leave the labor force altogether. The picture has worsened under Trump 2025-26. Job growth has slowed to a crawl and pay stagnated on average, while declining for millions at the median and below. The article then explains how this dire situation is about to get much worse, as next generation Agentic AI in 2026 is slashing millions of jobs this year and more the next.
Dr. Jack Rasmus
Copyright 2026
The Trump administration brags almost daily how great the US economy is and how well American workers are now doing. But the facts dramatically state otherwise. Here’s the facts about the current state of jobs and wages for the working class in America as of Labor Day 2026—and why the next two years both jobs and wages will get significantly worse. (All data is from the US government’s Federal Reserve and Labor Department databases or the Wall St. Journal).
There is nothing more important to a worker than having a job. Next important is a job that pays decently to allow a reasonable standard of living for his/her family. Third, a job with some promise of permanency—i.e. job security.
On all counts the state of the US working class this Labor Day 2026 is dire.
The Corporate Profits Picture
In contrast, corporate America the economy is booming. It’s never had it so good. In 2008, corporate profits as part of US national income amounted to $943 billion. By 2012 it had more than doubled to $2.2 trillion. Just prior to the Covid crash of 2020-21, in 2019 profits were $2.43 trillion. They then blew through the Covid recession and rose to $3.5 trillion in 2020-21. Big business did quite well during the Covid crash.
It didn’t stop there. Under Biden, profits continued to rise to $4.12 trillion by the time he left office in late 2024. And under Trump, rose to $4.53 trillion at year end 2025. Based on the first half of 2026, profits are on track to top $6trillion by the end of 2026. That’s almost a tripling since 2019!
With the massive near tripling of corporate profits since 2019, one would think job creation and wage gains followed suite. Maybe not a tripling. Of even a doubling. But at least an increase in low double digits. But they didn’t. Not even close. Not since 2008; nor since 2019; nor during the past 20 months 2025-26 under Trump.
The Long Term Jobs & Wage Picture: 2007-2026
(JOBS)
Let’s look at how the working class has fared in terms of jobs. Let’s start with the year 2007. That’s a peak year in employment, well before the crash of 2008-09 and the collapse and loss of tens of millions of jobs those years.
In 2007 the total size of the US Civilian Labor Force—i.e. all those employed and jobless but looking for work (in the US you can be out of work but not looking for work in which case you aren’t considered technically ‘unemployed’ and don’t show up in the unemployment rate statistics)—was 153.9 million.
According to the latest US jobs report for August 2026, there were 169.7 million in the Civilian Labor Force.
That means over the past 18.67 years, from 2007 through August 2026, the US created 15.8 million jobs. That’s roughly 850,000 jobs a year. Divided by months, it’s only 73,800 jobs a month.
Economists generally assume on average 125,000 new entrants enter the labor force monthly. These are students entering the labor market, former retirees having to return to work because they can’t make it financially, youths entering for the first time, and other categories of returnees.
In other words, since 2007 the US can’t sufficiently find jobs for citizens who want to enter the labor force and work.
So where did they go? They mostly dropped out of the civilian labor force altogether. The US government has a statistic for that. It’s called the Labor Force Participation Rate. It estimated 66% of the working age population in 2007 was in the labor force. It’s now 61.6%. That’s 4.5% fewer today. That’s 4.5% of a roughly 170 million today. Or about 7.6 million who’ve dropped out of the labor force altogether since 2007. By the way, they are without jobs but aren’t considered unemployed according to the way the US government calculates unemployment rates. Which means the current unemployment rate of 4.1% in August 2026 should be double that 4.1% at least.
Another labor department measure reveals the scope of the problem that the US is increasingly unable to find jobs for all its citizens who want to work.
It is called the Employment-Population Ratio. Given the rise in the US population, it estimates the percent of the population able to find work. Like the Labor Force Participation, that measure too is falling long term. As the US population rose from 303 million in 2007 to 343 million today, that ratio has fallen as well—from 62.7 to 59.1.
In other words, The US can’t create jobs to keep its population employed as it used to. More and more who can’t find work simply drop out—and are not counted in the unemployment rolls.
This is not about losing jobs due to recessions. That’s another separate cause. This is structural. It’s about an economy that can’t provide sufficient jobs long term for workers entering the labor force and wanting to work.
The past four and a half decades also shows a pattern of collaboration by politicians and corporations to consistently undermine full time job creation. In the 1980s millions of involuntary part time jobs were legally permitted for the first time in lieu of full time jobs. Their wages were less and few benefits were the norm. In the 1990s, millions more temp jobs were created with little or no benefits and no job security. Both part time and temp were legally excluded from the union contracts, where they existed. Free trade agreements after 1989 exported millions more full time jobs offshore. The advent of gig work after 2000 threw workers off regular company payrolls and adrift to find work as independent contractors—often contracted back by the same companies that fired them. Massive business tax cutting after 2001 further encouraged companies to replace millions of their workers with capital equipment. The government eventually reimbursing businesses for the full cost of the equipment that laid off the workers.
Tens of millions of US full time workers lost their jobs since 1980 to these various forces, or else were reduced to part time-temp-gig work at lower pay with few if any benefits and no semblance of job security whatsoever.
All these developments are examples of what’s called structural unemployment. They are apart and in addition to job losses due to recessions and business cycles, i.e. cyclical unemployment. Overlaid on the chronic, long term weakness in job creation, tens of millions lost work in the great crashes of 2008-09 and 2020-21, not to mention smaller recessions and periods of economic stagnation.
This weak long term, and growing weaker, US economy job creation record is about to get worse, much worse. It already is, in fact. The cause is the Artificial Intelligence technology revolution which began to have an impact in 2022-23 and now in 2026 is accelerating in its negative impact on jobs and wages of the US working class. More on which shortly below.
(WAGES)
The US Working Class has not fared any better since 2007 in terms of real wages.
If we’re talking about the working class, one should not include the salary and compensation gains for managers, CEOs and incorporated self employed like doctors, lawyers, small business, etc. The mainstream media likes to throw in their wages and compensation to make the overall wage numbers look better than they are.
The closes statistic of relevance for the working class is wages for what’s called Production and Non-Supervisory workers (PNSW), a subset of about 110 million workers who comprise roughly 81% of the US total private nonfarm workforce.
Real hourly wages for PSNW in 1983 was $8.03 (when adjusted for inflation using the government’s own base year of 1982-84, the most frequently cited statistic for adjusting for inflation). By August 2026 this had risen to $9.94.
That’s a real wage increase of about 4.4 cents/hr. raise a year since 1983!
That’s also likely an over-estimate for several reasons. First, it’s an average. Of the 110 million PNSW workers, those at the median were getting less than the top 10% and those well below the median even less. Second, there’s the question of the inflation index used, the Consumer Price Index, to get the real wage after adjusting for inflation. This author’s estimates conclude the CPI under-estimates actual inflation by at least another 1% a year. Third, even if not an average and if properly adjusted for inflation, it still does not mean the worker has $9.94 to spend. Take home pay after rising taxes and other deductions reduces the $1.14 gain even further. All this means real wages have not even risen the paltry 4.4 cents an hour per the government figures.
Real Weekly Earnings are another measure of pay. Weekly earnings are determined by the number of hours worked per week multiplied by the hourly wage and thereafter adjusted for inflation by the Consumer Price Index.
The results are similar to the hourly wage. The average weekly earnings for PNSW in 1983 was $272 a week. By August 2026 it was $336. That’s an increase of about $1.49 per year in weekly earnings.
The Short Term Under Trump: 2025-2026
Defining short term as the past 20 months of the Trump administration, January 2025 through August 2026, the data show both job creation and wages have slowed still further.
(JOBS)
Private Nonfarm Employment from January 2025 through August 2026 rose from 131.9 million to 132.7 million. That’s 800,000, or an average of 40,000 jobs a month, i.e. about half the monthly average of 74,000 over the longer term since 2007. In other words, nonfarm non-government jobs are being created at half the rate under Trump compared to the longer term since 2007. And don’t forget, that longer term since 2007 includes two massive periods of job loss in 2008-09 and 2020-21.
Government sector jobs not only did not grow at half the monthly rate under Trump but declined. Government employment in all sectors—federal, state, local—declined from 23.5 million in January 2025 to 23.3 million in August 2026, a 200,000 decline.
Both the Labor Force Participation Rate and the Employment-Population Ratio have also continued to fall under Trump—the former from 62.5% to 61.6% and the latter from 59.9 to 59.1. More workers thus continued to leave the labor force, or did not bother to enter, or else failed to find jobs and gave up. However, none of their numbers show up in the official US government unemployment figures. They are simply considered ‘missing’ by the government and never included in the calculation of the unemployment rate. Which is one reason why the unemployment rate hardly changes at all year to year now, despite the increasingly weak job creation picture.
Breaking down the aggregate Private Nonfarm Employment numbers by industry since 2025 shows little or no net job growth, or actual decline. Manufacturing jobs fell from 12.6 million to 12.4 million. Professional and Business and Retail Trade, two very large areas of employment, were both stagnant since January 2025 with no job growth: the former at 22.5 million and the latter at 15.4 million today as well as 20 months ago. Only the general services sector, where many unskilled and entry level jobs dominate, showed any gain—from 136.5 to 137.4 million. This is important to note since the current escalating impact of AI on jobs has begun to impact this sector of employment first and hardest.
For a number of reasons due to methodologies and data collection, the US monthly job reports tend to grossly overstate the number of jobs created. Those reports (based on two surveys called the Current Population Survey and the Current Establishment Survey) are later adjusted the following year by considering new data from the States’ unemployment insurance data.
In the last two years of the Biden administration, for example, the monthly job reports over-stated the actual number of jobs created by 598,000 and 898,000 jobs, respectively, according to the US Quarterly Census of Employment and Wages (QCEW).
In 2025 the total growth in jobs was estimated at 584,000 by the monthly jobs reports. That was adjusted down by -403,000 jobs for an actual total of only 181,000 jobs created the entire year 2025.
In the summer of 2025, even according to the monthly job reports, the US economy created only 35,000 jobs a month over three months. Big losses were recorded in key sectors like manufacturing, professional & business services, and government. In August 2025 Trump freaked out and declared the Bureau of Labor Statistics management was faking the numbers to make him look bad and he fired the director, McEntarfar.
In the summer 2026 job creation collapsed again, resulting in less than 30,000 new jobs in both June and July, although August numbers rose again to 162,000. However, the composition of the 162,000 is questionable—given that more than 100,000 of that number are attributable to bars & restaurants workers (59,000 gain) and teachers (42,000). Some economists note that the 59,000 was due to the one time surge to accommodate the world cup soccer events in the summer. Another 42,000 was attributed to education. One wonders how teachers returning to work in August is not considered a seasonality adjustment. Did K-12 education really grow that fast in one month?
It remains to be seen what the QCEW downward adjusted job numbers for 2026 will be when released in February 2027. Will Trump’s politics play a role? Or will the downward trend in job creation adjustment continue?
(WAGES)
The picture for short term wages under Trump since January 2025 is more certain.
There have been no gain the past 20 months under Trump in inflation adjusted hourly wages or weekly earnings for Production & Non-Supervisory Workers in the US.
The inflation adjusted average hourly wage was $9.93 in December 2024 and $9.94 in August 2026. Ditto for average weekly earnings: $335 in December 2024 and $336 today.
That means since 2007 the real hourly wage for PNSW workers was only 2.6 cents and hour. Compared to the 4.4 cents per hour average over the longer period, 1983-2026, the period 2007 to 2026 shows an even slower rate of real wage gain at 2.6 cents. As paltry as the amount is, the gains are declining over time.
And under Trump 2025-26, the gains have totally stagnated for both real hourly and real weekly earnings—in other words no gains whatsoever. And if inflation were more accurately estimated, or the median instead of the average considered, the real hourly and weekly pay would indicate a decline under Trump. Take home pay would fare even worse.
If the job creation and real wage picture for the Working Class is dire in 2025-26, what about the intermediate and longer term, 2027 through 2030?
As bad as it is today 2026 for the working class, it’s about to get worse—and quickly. The current trends in Artificial Intelligence are destined to accelerate the crisis in jobs and wages for the American Working Class. Here’s why.
The Agentic AI Jobs Armageddon
The AI Revolution is occurring in stages. The first stage emerged around late 2022 with the introduction of the AI model called ChatGPT. This was simple AI. Someone programmed the model to do a task. Gave it a result to achieve. Identified tools for it to get and use. Where to go for the data. Then set it in motion with a human user prompt. The user defined the parameters and ChatGPT performed the task faster than any human. And as it performed more, it got more accurate with fewer errors. Moreover, it worked 24/7. No breaks. Holidays. Vacations. No benefits. Faster and cheaper meant more productivity. That meant reduced unit costs and that translated into more profits. Not just from productivity but because it also resulted in significant layoffs of real workers. AI is about making money by reducing labor costs and boosting productivity.
ChatGPT and its competitors targeted the replacement of simply decision making jobs formerly done by humans. Jobs that required little skill. Where the decision process was clearly defined, unambiguous and repetitive. This meant a lot of entry level service as well as manufacturing jobs.
Research sources like Goldman Sachs bank and McKinsey Consulting issued early predictions of the potential job loss due to AI. Goldman predicted 300 million worldwide. Dozens of other sources have since issued forecasts and predictions of job loss. Nearly all talk of hundreds of millions lost plus more jobs de-skilled and downgraded (and therefore lower paid).
Occupations like data entry clerks, telemarketers, customer service reps, cashiers, medical transcribers, translators, copy and content writers, insurance underwriters, paralegals, basic software coding and many others were the initial jobs impacted by first generation AI ChatGPT 3-4 and its clones. By 2026 these occupations have already been decimated by millions with more job destruction in progress.
The second generation AI appeared in 2026. Its job impact will prove much greater than first generation ChatGPT. It’s called ‘Agentic AI’. And its target is jobs involved in the entire workflow of companies in general. Not just certain industries. Agentic AI is not industry specific. Agentic AI doesn’t depend on repetitive prompts from a human user, like ChatGPT. Agentic AI operates autonomously. Give it a final objective, it seeks out tools and databases wherever it needs them to complete its objective.
Agentic AI is about AI managing AI. It is AI scaled manyfold. Its scalability is potentially unlimited. It is AI that eliminates jobs involving not just simple decision making jobs but what’s sometimes called knowledge workers. It is AI moving up the skilled and complex decision making chain.
Agentic AI hit the economy in early 2026 with a force and a rapidity experienced by no other technology. It is just nine months old and its effect is intensifying. The lure of significant cost reduction and profits expansion has resulted in management rushing its implementation regardless of unknown disruptive consequences.
Agentic AI means an ‘orchestrator’ AI agent directs and manages the tasks of countless other agents under its direction. Emphasize ‘countless’. It is applicable to workflow management throughout all industries and companies. Job functions like project managers, product managers, marketing managers and middle to upper management in general are becoming, or soon will become, superfluous. Much of human resource functions, marketing, accounting, legal and other ‘back office’ work become redundant. Research analyst jobs of all kinds, including stock market analysts market research analysts, systems analysts, etc are all on the Agentic AI block. Traditional quality control jobs are destined to disappear. Agentic AI manages its own quality control tasks. If it makes an error it self corrects its code.
These are not entry-level or simple decision making jobs. They are jobs critical for managing the overall flow of work within virtually every company in every industry.
Most creative work within businesses is also subject to displacement by Agentic AI. Recent surveys showed, for example, that 40% of all song creation in the first half of 2026 had some element of AI in its production, and 20% of all songs were totally AI generated. TV and movie script writing is being similarly impacted right now as well.
Wherever an activity report is issued to or by management in a company—that activity and report can be potentially done by AI.
Earlier this spring 2026, META’s CEO, Zuckerberg, attempted to take the lead by implementing agentic AI throughout the company. His ‘Project OT’ (OT=Organization Transformation) planned to gut most middle layers of the company—including middle managers, project team leaders, software developers, etc.—and have agentic AI replace their tasks. Reports were up to 60% of META jobs would be eliminated or announced cut by November 2026. The META workforce heard of the plan and threatened to leave or demonstrate or even unionize. Zuckerberg backed off and reduced the 20% scheduled spring job cuts to 10% and cancelled planned November layoffs. META couldn’t afford an employee revolt, given its need to secure investor commitments and borrowing to fund its massive AI investing plans.
In recent interviews, Microsoft’s Bill Gates and Google’s Eric Schmidt, made predictions about the impact of this latest stage of Agentic AI on employment in general.
Gates noted the unprecedented rapid pace of AI development with Agentic AI and warned 50% of all entry level jobs will be gone in two years. That’s tens of millions of US jobs. The unemployment rate, now stuck at around 4% in recent years, will range between 10%-20%.
Eric Schmidt, former CEO of Google, has publicly declared people “have no idea what’s coming in 2027.” Only 10% of the impacts of AI are now known, according to Schmidt. There will be an unlimited number of AI agents in two years, he warned. Already, Anthropic Corp’s ‘Claude’ leading edge Agentic AI is doing 80% of all software coding, he added.
Whereas first AI generation ChatGPT eliminated simple service decision making, Agentic AI targets the huge Business & Professional Services sector of the US economy with its 22.5 million jobs. (jobs already not growing in recent years per earlier data). The target is also the 20 million current US middle-upper management jobs. Both sectors are especially vulnerable to next generation AI replacement.
Agentic AI has also begun to transform ground transportation and manufacturing sectors, and by 2030 will begin to displace the 4 million K-12 public school teachers as well.
AI is already impacting the 2.2 million long haul truck driving industry. 18 wheeler trucks are already traveling across Texas without drivers in the cab. There’s another 1.3 million short haul truckers’ jobs also eventually at risk as well. Uber has 1 million ride-sharing drivers. UPS 100,000 drivers. 134,000 deliver for Amazon. 250,000 drive trucks for the US post office. With Agentic AI, each self-driving vehicle becomes an AI agent with an ‘orchestrator’ AI agent located at company headquarters directing them, planning and changing to the most efficient routes on the fly, avoiding congested traffic flows—all tracked simultaneously via a company’s access to dedicated low orbit satellites.
As knowledge workers, K-12 teachers are well adaptable to displacement by Agentic AI. One can easily imagine State governments defining centralized lesson plans for most academic subjects in K-12 public schools and delivering teaching services by various multi-media devices in the classrooms. Skilled teachers today replaced by lower paid, less skilled humans in the classroom operating the machines and monitoring classroom behaviors. Teachers become babysitters and classroom machine operators. Those that remain in the less skilled roles will consequently be paid less.
Then there’s what’s called ‘Physical AI’, i.e. robots. One has only to view the videos of the current level of AI development in China to understand the rapid pace of development of ‘physical’ AI now underway. And it’s only beginning. The use of human-like AI engineered robots is accelerating exponentially. Already humanoid robots are directing traffic in crowded inner-cities in China.
Not least, the use of Agentic AI in the military is unlimited. It too will negatively impact jobs. Agentic AI is perfectly adaptable to battlefield management. Hundreds and thousands of airborne drones today already engage daily in the war in Ukraine. Swarms of underwater and land-based drones are being prepared. Battlefield management by Agentic AI of individual AI agent military vehicles, weapons systems and robots is on the drawing boards by all major military powers—China, Russia, the US in particular. Fewer human recruits to the military in the US will be required within five years. Today’s 1.3 million active US military force will be reduced by tens and hundreds of thousands of human recruits. The US military recruited 163,000 in 2025. That level will no longer be needed and will be reduced by tens of thousands annually. Those rejected will be forced to enter the labor force instead, at a time of massive structural unemployment due to accelerating next generation AI.
How do all these impacts current and imminent result in job destruction due to Agentic AI and whatever comes next, 3rd generation?
If Gates is accurate in predicting the unemployment rate will surge to 10%-20%, that means the current 7 million unemployed full time workers today in the US (i.e. the 4.1%) will total 25 million unemployed—assuming just a 15% unemployment rate. And if Schmidt is right, that’s potentially within the next two years, by the time of the next US general election in 2028.
And that 25 million will not count any unemployment driven by a business cycle contraction and next recession that this writer predicts will occur before 2028. But that’s another story.
Dr. Jack Rasmus
September 7, 2026
 Dr. Jack Rasmus @drjackrasmus