Listen to my Oct. 9 (thursday) Critical Hour radio interview, reflecting on what’s behind the 4 months of Hong Kong protests + my assessment and prediction of a 60-40 probability of a US-China ‘light’ trade deal (which as of Oct. 11 has occurred).
Archive for the ‘Uncategorized’ Category
Reflections on Hong Kong Protests & Upcoming US-China Trade Talks–audio
Posted in Uncategorized on October 11, 2019| Leave a Comment »
US-China ‘Mini’ Trade Deal + Revisiting the Repo Market–audio
Posted in Uncategorized on October 11, 2019| Leave a Comment »
For my analysis of media reports today on pending US-China ‘mini’ deal on trade check out my radio show analysis today on Alternative Visions show. (Also, discussion of recent reports just issued by the Bank of International Settlements and Financial Stability Board suggesting that shadow banks in the Repo market may be part of the problem for that market’s recent spike in interest rates).
TO LISTEN GO TO:
http://alternativevisions.podbean.com
-
SHOW ANNOUNCEMENT
Business and mainstream media today talking up a likely ‘mini’ deal on US-China trade. What’s behind it and what’s likely to be covered. China’s call for a ‘fair’ deal means a mini deal, minus any agreement on the nextgen tech issue. Trump’s ‘big deal’ will mean no tech issue resolution. So why is Trump now willing to take what’s on the table (same as last May 2019) and forego his ‘big deal’? Rasmus discusses the various economic reasons Trump may settle for less today, and continue attacking tech issue by other means. Is the ‘mini’ deal pending with China another ‘softball’ deal per So. Korea, Japan, USMCA, EU trade agts? Trump’s trade war a dismal failure, as US trade deficit hits record $55b in August. The second half of show revisits the Repo Market instability topic once again, provides updates on Fed’s $400 billion money injection, discusses whether it’s ‘QE’ again, and reviews just released BIS and FSB studies showing role of shadow banks in the Repo market may be part of the problem. The show closes with comments on 7m US auto loan defaults, and the chronic problem of a rising US dollar. (Next week: Neoliberalism as ‘Idea’ of academics and intellectuals vs. Neoliberalism in ‘Practice’)
On Trump’s Collapsing US-No. Korea Negotiations
Posted in Uncategorized on October 9, 2019| Leave a Comment »
US Neocons continue to drive US-No. Korea negotiations, as it now appears discussions with that country are essentially ‘dead in the water’. Listen to my interview with Critical Hour radio on how Trump and the US negotiates with adversaries: first by imposing sanctions, followed by threats that opponents must concede to US demands, and only thereafter will the US will consider possibly withdrawing some sanctions. How this approach to foreign policy in general is reflected in US-China trade negotiations, where the US has imposed tariffs, then demands China capitulate on the technology issue, and then says only then the US may reduce tariffs…maybe. The US pattern of demanding capitulation (instead of quid pro quo negotiations) first, and then the US will consider adjustments to its bargaining position, is today being repeated with No. Korea, China, Venezuela, Iran, and elsewhere. Why Trump’s approach and policy is not simply his own but is in full agreement by Democrat party leaders and the Pentagon as well.
-
To Listen GO TO
:
https://drive.google.com/file/d/1F5yFrjx11FO24_0a9QjfTEbsPc_pTQvC/view
Sept-Oct Tweets on Tradewar, Fed, Repos, US economy, Argentina crisis, etc.
Posted in Uncategorized on October 9, 2019| Leave a Comment »
Check out my Sept-Oct. Tweets on tradewar, the Fed, Repo market, US economic slowdown, income inequality, Argentina crisis, wages, jobs data accuracy, economic reports of interest, etc. (Follow me for immediate info posting at @drjackrasmus)
·
Oct. 8
#tradewar
Why won’t Trump release Japan-US trade deal full text? Why is it being kept classified? Why did Trump deal leave untouched Japan’s $56B annual auto exports to the US? Or open up Japan’s auto market to US exports to Japan? Is deal Trump’s ‘back door’ to join the TPP?
Oct. 8
#tradewar
Trump signs ‘softball’ trade deal with Japan. Makes concessions for Japan to buy more US farm goods. Brags US agribusiness got $28B so far in direct subsidies & more coming in 2020–paid for by US consumers. Chase bank survey: $1K ave. household hit from tariffs so far.
Oct 6
#Fed
Trump v. Powell fight over lowering fed funds rate looks increasingly irrelevant, as repo mkt overtakes fed funds as key mkt. Ave. daily volume Treasuries traded in fed funds mtk=$68b. Ave. across repo mkts? $1 trillion. Lowering fed funds rate not about US economy, but US $
Oct 6
#tradewar
18 mos. of Trump trade wars and US trade deficit hits another record of $55b last month, a rate of $660b for 2019. Will reduce 3Q19 GDP, along with contracting manufacturing, construction, and business investment. Rising prices from tariffs soon to hit consumption next.
Oct 4
#repomarket
‘QE’ by another name already underway as Fed expands & extends its Repo market buying program to Nov. 12. In addition to Fed’s >$150b already injected, new longer term (6-14 day) purchases of $160b+more short term buying as well. Total $400-$500b in less than 2 mos.
·
Oct 3
#USeconomy
My January 2019 prediction of US recession by 4Q19-1Q20 coming closer: US manuf. this week hits 10 yr. low; Services PMI falls to 52 (forecast at 55). Now watch for lagging jobs numbers for Sept & then Oct to catch up as well. Consumption will then follow by year end.
·
Sep 24
#USeconomy
With construction, manufacturing, bus. investment slowing, flat, or contracting, only sector holding up US econ is consumers. Chase Bank research estimates $1k hit to households starting Sept. due to tariffs. Consumer confidence expectations Sept contracting, 106 to 95
Sep 23
#Fed
The Repo mkt instability means Fed is back where it was decade ago: QE again, now thru a permanent Repo facility soon. Now even before full financial crisis. Hundreds of billions $ injected so far. How much more to come? Meaning? Mkts addicted to every more money injections
·
Sep 19
#repos
The Fed’s piling $ into Repo mkt 4 days in a row now. What’s up? Is Repo mkt next locus of financial instability? energy junk bonds; BBB corporates; leveraged loans; CDOs? Listen to my radio show friday for discussion at
Alternative Visions
Sep 19
#Argentina
stats tell the tale: inflation up 57%. Peso down 30%. Official unemployment 10.5% & accelerating. Benchmark interest rate 14.5%…not least, stock market up 100% this year. IMF wants more austerity: consumer tax hikes, layoffs, higher utility prices, sell govt assets.
Sep 19
#incomeinequality
biggest driver of inequality is not falling wages; it’s stock buybacks & dividend payouts. Will exceed $1.3T this year for F500 corps alone. Microsoft announces another $40B buybacks + 11% more dividends from its $52B profits this year. Prior buyback was $35.7B
·
Sep 17
#Fed
Why will Fed cut interest rates another 0.25% tomorrow, when banks are sitting on $1.45 trillion in excess (i.e. loanable) reserves already? With inflation officially at 1.6% (actually>2% Fed target)? And unemployment officially at 3.7%? Why? Cuz $US too high and rising.
Sep 17
#tradewar
Trump’s paying US farmers almost $30B so far in aid as China cuts US farm purchases. Who’s getting the $30B? Recent study shows top 1% (agribus/big farmers) got ave. $180,000; bottom 80% got $5k in aid. 12,800 US farmers went under in 2018, first yr. Trump’s trade war.
Sep 16
#Pharma
Perdue pharma cuts a legal deal today to shield itself from further legal suits, as Sackler family members quietly divert their billions$ to safe havens. 50,000 opioid deaths in the US annually; prescription opioids pushed by companies like Perdue responsible for 36,000.
Sep 15
#Oil
Will Saudi Oil sites drone strike reduce global supply & raise US gas prices? US produces 12m bpd, uses < 12, & exports 3m bpd. Has 544mb strategic reserve + ? more private reserves. Saudis have 188m reserve. US can cut exports or use reserves but won't. Gas prices will rise
·
Sep 14
#USrecesssion
Jeffrey Gundlach, CEO of Doubleline & predictor past US recessions, says 75% chance US recession by end 2020. Adds no deal on trade with China before. Growing list of big investors predicting same. Current mkts & US economy='dead cat bounce'. My same forecast.
Sep 13
#IMF
now engaged in 'tightening the screws' further on Argentina, by withholding sending next tranche of $56 billion bailout until it sees Argentina imposing even more austerity on households to pay it back. Argentina economic crisis contagion to Uruguay underway, and then Brazil
·
Sep 12
#tradewar
Trump signals willing to accept a 'partial' deal with China. Meaning? US will take China concessions already on the table (51% US ownership in China, China buys $1 trillion more US farm goods, etc.) and settle for later deal on nextgen technology (5G, AI, cybersecurity)
Sep 11
#income
Govt says median income up only 0.9% in 2018, statistically insignificant from prior year. So who got the reported 3.1% wage gains last year? Tech engineers, professionals, supervisors, advance degreed, etc. All skewed to the top. Studies show 60% got no wage hike at all.
·
Sep 10
#Bolton
Trump fires neocon NS advisor Bolton today. Why not. Bolton architect of failure to get deal with N. Korea, failure to bring about regime change in Venezuela, push for war with Iran, and stalled trade deal with China. Trump wants resolution on all areas by 2020 election
Sep 9
#Finance
capitalists stick together. Billionaire Singer's Elliot Mgmt attacking AT&T. Wants break up. Owns lot of stock. Will make millions. Trump (a commercial property speculator) applauds move. Why? AT&T owns CNN, which Trump hates. Trump got billions for Singer. Now payback.
·
Sep 9
#tradewar
US Treas. Sec'y, Mnuchin, today said Oct. mtg with China to focus on China currency manipulation. But China's been entering mkts to prevent Yuan devaluing, not opposite. Does Mnuchin want China to let it devalue? And offset Trump tariffs? Manipulation claim is nonsense
Sep 7
#tariffwar
Who's winning US-China tariff war? China is. Despite Trump's $375B tariffs, US imports from China last month rose 6.4%; conversely, China imports from US fell 3.3%. US goods deficit with China rising. Record deficits too with Japan and EU now. 18 mo. war & no progress.
Sep 6
#FannieMae
Trump proposes privatizing Fannie/Freddie. What's behind it? Big profits for hedge funds & other speculators in new IPO of F/F + access to future profits now going to Govt. Result: home buyers 30yr. mortgages will rise significantly. Thus, more income inequality shift
Sep 6
#jobs
Want to know why the real unemployment rate in the US today is 10% at minimum, not the 3.7% peddled by the mainstream media? Check out my latest blog post, 'What's the Real Unemployment Rate in the US'
.
Sep 4
#USeconomy
US joins Germany, UK, Japan, etc. in global manufacturing recession. BIG drop in US PMI last month from 51.2 to 49.1 (<50=recession)+ Univ Michigan consumer index falls most since 2012 + After 18 mos & $500B tariffs on China, US trade deficit with it still expanding
Sep 3
#India
US-China trade war, UK hard Brexit, German-EU recession, global manuf. contraction, Italian banks, Argentina default, global oil price deflation…but watch out India as point of crisis: Banks defaulting, scandals, record non-performing bad debt, consumption falling, etc.
Sep 2
#wages
Multiple independent surveys (Bankrate, Payscale, McKinsey, etc.) show wages are not rising by 3.1% as US Govt claims. Want to know why? Check out my latest blog post for Labor Day
.
·
Aug 31
#Fed
Does anyone still believe Fed policy is about keeping inflation at 2% & reducing unemployment? Fed to cut rates again Sept., when inflation is 1.6% and falling, and UE rate=3.8%. Fed's real target is stock & currency prices. Ditto Europe, UK, Japan, & central banks worldwide
·
Aug 30
#currencywar
Trump complains today Euro currency falling. Makes EU exports more competitive with US by lowering Euro + will offset future US tariffs on EU. US must cut rates to lower $ but $ rising. World now entering "currency devaluations by competitive interest rate cutting"
Aug 29
#tradewar
today China says won't retaliate to Trump's latest tariffs hike before mtg. Will Trump also back off? Neocons now running US trade policy want China capitulation on nextgen tech (AI, 5G, cybersec) before deal. Behind trade war is technology war. Tech issue=crux to deal
·
Aug 29
#Argentina
looks like 'Greek Debt Crisis writ large' as investors see default coming on $56B IMF loan. IMF now negotiating a restructuring & extending of its debt. Will demand in turn more austerity and for longer period. Greek debt crisis and economic depression 2010-18 deja vu!
California’s Proposes Public Banking–radio interview
Posted in Uncategorized on October 5, 2019| Leave a Comment »
Listen to my 15min. short version assessment of California’s just proposed public bank initiative, and the pros and cons of public banks in general, in the following Critical Hour radio interview. To Listen
GO TO: https://drive.google.com/file/d/1TVGP28Bkad2uYCsLdl7v5sbNlibjtejS/view
California’s Public Bank Proposal + US Economic Indicators Update–audio
Posted in Uncategorized on October 4, 2019| Leave a Comment »
Listen to my analysis of the pros and cons of public banking as California announces proposal to start a public bank + update on US economy’s PMI indicators for both manufacturing and service sectors dropping fast.
TO LISTEN GO TO:
http://alternativevisions.podbean.com
-
SHOW ANNOUNCEMENT:
This past week California proposed the creation of a public bank. What are the pros and cons of a public bank? Why a public bank would benefit Californians. Why public banks aren’t panacea solutions to a US chronic slow growth economy approaching recession once again. The limits of monetary policy, whether QE, MMT, or public banking. Why advocates of monetary solutions always over-estimate the role of money supply, interest rates, and bank lending. What really drives capitalist investment and economy. Why money is necessary but not sufficient. Public banking (and MMT) as QE turned on its head. Rasmus introduces show with discussion of latest US purchasing managers index for services and manufacturing now slowing and contracting, and why job numbers are becoming weaker and will soon follow by year end or sooner, as US economy slowly joins the global economic slowdown. Why Trump may strike a deal with China—i.e. take the money and run and leave the tech issue for another day. (Next week: Ukrainegate, Trump, and the Decline of American Democracy)
Repo Market & Other Signs of Growing Financial Instability–audio
Posted in Uncategorized on September 24, 2019| Leave a Comment »
The big topic of last week in economics was not the Fed’s decision to reduce rates, nor Europe-Germany’s continuing industrial recession nor the US-China trade war nor anything else. It was the near collapse of what’s called the Repo Market for bank lending based on US Treasuries. Since the eruption, the Fed has injected hundreds of billions of dollars into the market and plans to continue to provide hundreds of billions more between now and mid-October. It will likely continue to do so permanently from this point. What does the Repo instability represent? Is it the ‘black swan’ (or at least gray) signaling the next financial crash? Listen to my take and analysis on the importance of this event from my Alternative Visions radio show of Sept. 20, and the event as harbinger of what is likely more global financial instability ahead.
To Listen GO TO:
http://alternativevisions.podbean.com
-
SHOW ANNOUNCEMENT
Dr. Rasmus dissects this past week’s spike in Repo (Repurchase Agreement) bank to bank lending market and what it means for growing financial instability in the US and globally. Candidate for financial market instability in US and worldwide are reviewed (junk bonds, BBB, leveraged loans, CDOs, etc., as well as India-Europe banks, China markets, Argentina, etc.). further slowdown of world real economy and trade underlying and interacting with growing financial market instability. Competitive devaluations via central bank interest rate and currency wars. Trump’s narrow view of tariffs and Fed rate cuts. Why the Fed was divided on last rate cut this week. In the midst of all this, the US Repo market rates spike to 10%. Official short term explanations not acceptable. Longer term more fundamental causes: Fed pulling money out of bank reserves via bond operations and balance sheet sell off in order to finance US $1 trillion plus budget deficits. Banks now addicted to more excess reserves after QE, financial structure changes since 2008, etc. Fed will now restart ‘QE Lite’ via Repo market injections (4 times this week). More Negative Rates worldwide and balance sheet ballooning again inevitable now. Fed and central banks policies no longer as economic stabilization tools but as main conduit of capital market incomes subsidization tools. Fed and central banks now secretely planning even more radical innovations next year.
Fed Cuts Rates 0.25% & Repo Market Instability Rising–radio interview
Posted in Uncategorized on September 20, 2019| 4 Comments »
Listen to my interview commentary on the Fed’s latest rate hike; why global economic slowdown and more indicators of US economy weakening will have greater net effect slowing US economy than jobs and consumers spending holding up economy; why Fed cut rates only 0.25%. Fed rates, dollar appreciation and Trump tariff-trade war nexus. My initial explanation of what’s going on in the Repo market where rates spiked to 8%: Fed selling off its balance sheet and desperate financing of US annual $1T budget deficits. Is it a harbinger of financial crisis brewing? Is new QE coming soon?
TO LISTEN GO TO:
https://drive.google.com/file/d/1dQQmly8ojIfE3eGNMPD1kpxTkwO27upn/view
Autoworkers Strike GM: Is Labor Awakening?–Video
Posted in Uncategorized on September 18, 2019| 1 Comment »
Watch my 7 min. video interview of the Autoworkers strike against General Motors that began this week.
GO TO:
The Keynesian Approach?
Posted in Uncategorized on September 17, 2019| 1 Comment »
One of the astute readers of this blog, Benl8, recently commented on my latest post of my recent radio show commentary on ‘Central Banks, Negative Interest Rates,and Helicopter Money’. Ben originally commented what is Keynesian economics to the UK Marxist economist M. Roberts’blog, and then re-posted his comment below to my blog, asking me “I wonder what Jack has to say about this Keynesian approach”. So I thought it useful for me to reply to Ben’s welcomed inquiry and give readers of this blog a sense of where my economic views stand in relation to Marx, Keynes, and post-Keynesian economic schools of thought. Are my views Keynesian? Marxist? Minskyan? Whatever. Here’s Ben’s post and re-post and my own in depth reply:
Benl8;
“I left the following comment at M. Robert’s (A British Marxist economist–my paren) recent post on the same topic. I wonder what Jack has to say about this Keynesian approach. ——-
“Pushing on a string”, is the often chosen description of this policy. Futile is the end result. I’m trying to read about the Reconstruction Finance Corporation which operated from 1932 to 1952. After WWII it was phased out. In the 30s it saved mostly solvent banks with emergency loans, and it bought railroad company debt. Mostly in the 1930s the WPA was the conduit of money, it transferred money directly to workers and families, it was direct job creation, the rate of unemployment dropped from 25% to 9.6%, 1933 to 1937. Keynes also had a solution for perpetual surplus nations, the creation of an International Monetary Clearing Union. This would prevent the race-to-the-bottom in wages that we see with China-US trade. And in the case of Germany, or any surplus-mercantilistic nation, it would require the surplus funds to be invested in the deficit countries. From Paul Davidson’s book The Keynes Solution, page 138: It would encourage creditor nations to “spend these excess credits in three ways: 1.) on the products of any other IMCU member (import more); 2.) on new direct foreign investment in projects in other IMCU member nations (projects, not financial assets); 3.) provide foreign aid similar to the Marshall Plan. And a fourth, maybe, raise wage income in the surplus nation such as increased Earned Income Tax Credits. It’s all about aggregate demand and a balance of income distribution, within each nation and between nations. Direct job creation is a good part of the Green New Deal, some of it targeted to specific low-income communities and geographies. But most of it spent on upgrades and transitions to renewable energy. I’m not sure what Marxists are calling for, but this is state-managed capitalism, and it may lead to the more socialized condition of a world economy. My blog: http://benL88.blogspot.com
Jack Rasmus Reply to Ben
Classical economics was big on supply side approaches to economic growth. Add more capital, more labor, more land and in the long run that produced more products–i.e. supply. They were not very big on consumer demand that might stimulate that production in the shorter run (except for Malthus who had the crazy idea to stimulate demand by diverting more income to landowners. Malthus was a big landowner of course).
Marx’s economics is in the classical economics tradition. Marx uses the same classical conceptual framework, which he redefines in some ways but still remains well within. Example: the classical labor theory of value by Smith, Ricardo and others gets a work over and becomes the basis for explaining Capitalist growth slowdown by Marx–but like his classical economics predecessors, in the long run (i.e. Marx’s breakdown theory). But Marx, like the classicalists before him, Smith, Ricardo, Malthus, et. al., never had an explanation for the business cycle. That’s short run. Even depressions. Nevertheless contemporary Marxist economists continue to try to apply his long run, supply side views on capital accumulation and labor exploitation to explain short run business cycles. Marx never intended that, however. The classical economics conceptual framework, built to explain long run growth or the lack thereof, does not work to explain shorter run business contractions, including depressions. Nor does Marx, or contemporary marxists, give much attention to financial cycles and how they periodically impact real cycles in the short run creating recessions, great recessions, and even depressions. Capitalist financial markets were undeveloped in mid-19th century Britain (the basis for Marx’s data and empirical analysis). Smith, Ricardo and other classicalists understood banking and finance even less. Marx not much better. (One exception might be the banker, Thornton, whose works are often not read). ANd Marx did not give sufficient attention to effective demand, although it plays more a role than in SMith-Ricardo-JB Say. (Yes it was part of his circulation of capital system of analysis but demand was the consequence of production, which was primary. What he called ‘realization crises’ recognized demand as a factor, but production was the driving force of exploitation and therefore of the movement and circuit of capital from inputs to goods to money back to inputs again) . Marx was the most advanced thinker among classical economists, working with their conceptual framework and even advancing it as far as it could go. But capitalism has evolved tremendously since 1850s Britain. It has become more financialized. It has become more globalized. It has radically transformed labor, product and money markets. The nature of money has itself changed. Unfortunately, contemporary Marxists (not all, but especially Anglo-American) have not kept up with these changes (which is very un-Marxist by the way). They instead continue to try to ‘fit’ modern capitalist dynamics into 1850 classical economic theory. Or, in other words, ‘fit’ a square reality into a round hole of past theory.
Keynes broke from the classical and neoclassical economic traditions and tried to create a new analytical framework. He succeeded only partly. And his theory was furthermore distorted by the counter-revolution in economics that followed after world war II that attacked his ideas. What followed attempted to cherry pick what it found useful in Keynes while largely restoring pre-Keynes economic nonsense called neoclassical economics and create a hybrid, a ‘bastardized’ form of Keynes. What purports to be Keynes today is mostly not Keynes but this hybrid ideological synthesis that is sometimes called ‘Keynesianism’ or Keynesian economics.
The real Keynes attempted to develop understanding of short term contractions called business cycles, how and why they occurred and how to recover from them. He debunked neoclassical economics before him. The key he argued was household demand. That was driven by employment. And employment could only be driven by government spending in a deep contraction of a business cycle. He argued against cutting interest rates and cutting business taxes to boost investment first. It wouldn’t work, he argued. What drove investment was not cost of investment (whether taxes, cost of money, etc.). Business cost reduction in a contraction of the cycle would not generate investment nor in turn a return to production and therefore jobs and income to stimulate consumption. Raising consumption directly is what would restore investment (not tax cuts, low rates, wage cuts or even price increases). Getting disposable income in the hands of consumers was the crux to recovery. That could be done in a variety of ways. Get the government to directly hire the unemployed when businesses wouldn’t. Provide unemployment insurance payments. Set a minimum wage. Start public works projects that would create construction jobs. Let unions become legal and expand. That too would raise wages of those with jobs. Provide social security for retirees. Take over mortgages and refinance them for 30 years, instead of the then typical 10 at the time, in order to lower mortgage payments and in turn give households more money to spend (the Home Owners Loan Corporation which functioned much like the Reconstruction Finance Corporation). The New Deal of FDR looked very much in practice what Keynes was advocating in theory. The idea was to raise disposable household income, that would drive consumption, that would in turn provide an incentive for business to invest again, and thereby hire more workers, raise income, etc, and commence a virtuous ‘upward cycle’. It was ‘bottom up’ recovery. Households and workers got recovered first, then ‘trickled up’ via consumption to business revenue, profits, and eventually into more investment.
But capitalists, and especially bankers, don’t like ‘trickle up’ and they own the politicians who vote on programs. They also determine the composition and policies of the central banks. So we get instead now bail out the bankers and continual subsidization of them even long after they’ve been bailed. We get bail out both bank and nonbank businesses via constant, chronic trillion dollar tax cuts and direct subsidy fiscal policies. The ideological argument is then that they will ‘trickle down’ some of their great profits to in turn boost real investment to create jobs and income for workers and households which then boosts consumption. That’s the logic offered as truth and reality but it just doesn’t work in that direction. In today’s 21st century capitalism the ‘trickle down’ has become a mere ‘drip drip’. Most of the tax cuts, and monetary policy of near zero interest rates and free QE money, doesn’t get into real investment in the US any more. It flows instead offshore in today’s globalized capitalism where US multinational corporations increasing invest and produce (they call it ‘supply chains’); or it gets diverted into financial markets that cause stock, bond, and derivative bubbles (that also don’t create any US jobs); it goes into mergers & acquisitions financing that only makes shareholders richer; or it is left to sit on corporate balance sheets waiting for the next lucrative financial or offshore investment opportunity to come. Keynes began to see this in 1935. Check out his Ch. 12 of his General Theory book. Marx had no idea of this in his first volume of Capital published in 1867 (based on 1850s-60s data in Britain). But Marx began to suspect the outline of this development in his unpublished notes in vol 3 of Capital. Gathered together by Engels, from the notes it is unclear who the author is sometime, Marx or Engels, the latter of whom was far less an economist than Marx).
So both Marx and Keynes were on to something abut the key role of employment, household income, demand and consumption as key to understanding business cycles. Marx only vaguely so; Keynes even more so. But both were still before their time.Their views don’t adequately explain 21st century capitalism business cycles.
The economist Hyman Minsky attempted to take Keynes into the world of late 20th century capitalism that was beginning to transform from what Keynes in 1930s saw. Minsky wrote from the 1970s to the early 1990s. So he had a clearer view of what was going on, but still could see only the early outlines of what was coming in 21st century capitalism.
Readers should go back and read Marx’s vol. 3, Keynes General Theory, and Minsky’s 1990 articles. (For my take on all this, see my extensive Part 3 of my 2016 book, ‘Systemic Fragility in the Global Economy’, that reviews classical, Marx, Keynes and Minsky views, and then summarizes my own early views on how 21st century capitalism evolves as financial cycles interact with real cycles–sometimes producing ‘normal’ recessions, sometimes ‘epic’ recessions (that some call ‘great recessions), and occasionally bona fide economic depressions.
Davidson’s book referred to by Benl8 is in the tradition of trying to restore Keynes’ actual views, not just the errors and ideology of the hybrid Keynesianism that is a synthesis of pre-Keynes with Keynes in the worst combination. That hybrid Keynesian view mis-taught generations of young economics students from the 1950s to the 1970s, until it was overthrown by a full retreat back to neoclassical economics led by Friedman’s monetarism, the Chicago school, and dozens of nonsense offshoot theories after 1980. Davidson is in the school of what’s called ‘Post Keynesians’, who try to go back to the original views of Keynes. Minsky would be a ‘Financial Keynesian’ of which they are more today (Wray, Keen, Tymoigne, etc.). Contemporary Marxists, especially the Anglo-Americans (the Europeans and emerging market Marxists are at least trying to revise Marx to the realities of 21st century capitalism), are still mostly trying to stick square pegs in round holes. Contemporary marxists aren’t really marxist economists. They are Marxist Philologists. There’s a few notable exceptions, like Harvey who are more open minded.
Keynes of course, and Minsky as well, do not have all the answers. Capitalism has evolved even beyond them. But they do have something of great value to add to our understanding of the role of income, demand, consumption, the destabilizing effects of financial speculation and bubbles, etc., as well as current day capitalism in general and should both be read. But read only in the original. My recommendation is don’t waste time with third party summaries that mostly distort intentionally, or who haven’t really understood or even perhaps read Keynes or Minsky. (ditto for Marx who should not only be read in the original; but I would add also read backwards; that is, start with vol. 3. Or first read Marx’s pamphlet, ‘Value, Price and Profit’ and then read vol. 3). But you’ll only really understand Marx if you immerse yourself first in the main texts of classical economics: Hume, Carnot, Smith, Ricardo, Thornton, etc. (You can skip Malthus.)
For my views in relation to all three–Marx, Keynes,Minsky–there’s my 2010 book,’Epic Recession'(2010), the chapter on ‘What’s Financial Imperialism’ in my book ‘Looting Greece: A New Financial Imperialism Emerges’ (2016), the last chapter in ‘Systemic Fragility in the Global Economy'(2016), and the final chapter in ‘Central Bankers at the End of Their Ropes'(2017).
Hope that addresses some of the excellent points made by Bl8, who always provides thoughtful questions and comments.
Dr. Rasmus on Twitter
Jack’s Weekly Radio Show, ALTERNATIVE VISIONS
NEW BOOK
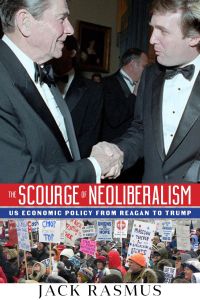
While the capitalist system has undergone numerous restructurings throughout its history, capitalist elites purpose in restructuring has remained the same: to restore and/or extend their hegemony. The current restructuring, operative since 1978, is called Neoliberalism. The book examines Neoliberalism as both an Idea and an historical practice composed of a particular mix of fiscal-monetary-trade-industrial policies that began with the latest US capitalist restructuring in the late 1970s, continuing to evolve to this day. The book further explains the deeper material forces giving rise to - as well as now undermining - the Neoliberal policy regime, with special focus given to the crisis of Neoliberalism in the wake of the 2008-09 global crash, Obama's failure to resurrect it, and Trump's current doomed effort to restore it in a new, more aggressive form. Evidence why Neoliberalism is destroying US Democracy concludes the book's analysis.
NEW BOOK
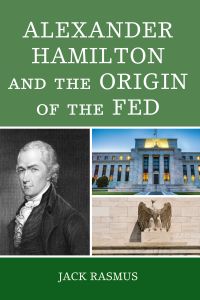
Describes how US federal governments, often in cooperation with the largest US private banks, introduced and expanded central banking functions from 1781 through the creation of the Federal Reserve Act of 1913. Based on an analysis of the evolution of the US banking system - from pre-1781, through the 1787 US Constitutional Convention, Congressional debates on Hamilton's reports to Congress, the rise and fall of the 1st and 2nd Banks of the United States, and through the long period of the National Banking System form 1862-1913, the book shows how central banking in the US evolved out of the private banking system, and how following the financial crash of 1907 big New York banks pushed through Congress the Federal Reserve Act of 1913, creating a central bank which they then managed for their interests.
BOOK
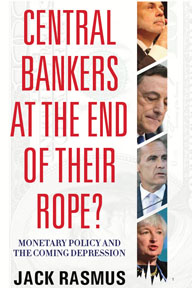
(Click on image) CENTRAL BANKERS is a comprehensive critique of central banks’ policies in the 21st century, explaining why the massive injections of free money to the banking system since the 1970s enabled the creation of excess corporate debt that has led to financial bubbles and repeated crises. The book addresses the growing contradictions of central banking, why they are failing in their functions, targets and tools, and proposes a radical democratization and restructuring to transform them to serve the public interest and not the private banks.
Book:
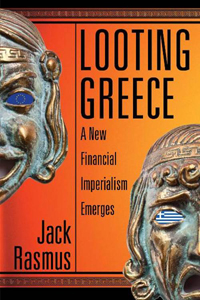
(Click on image) LOOTING GREECE, A New Financial Imperialism Emerges. This book - Reveals clearly who calls the shots in the Eurozone—the hardliners, not the remnants and political residue of what was once European social democracy, - Follows the negotiations in their excruciating detail as the Troika tightens the screws from 2009 to the present, - Shows how Europe’s financial elite enriches itself on Greek debt, privatizations and financial manipulations, turning Greece into an Economic Protectorate.
Book:
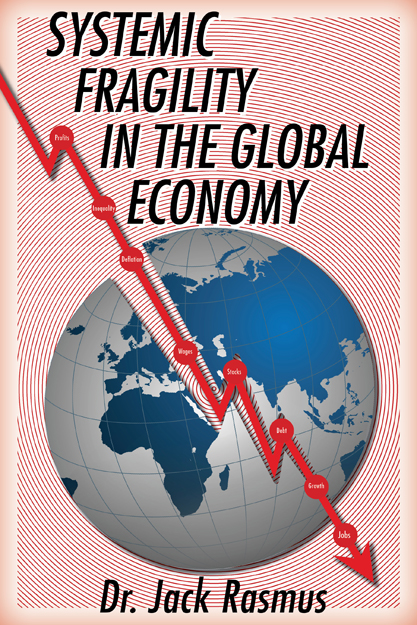
(Click on image): This book offers a new approach to explaining why mainstream economic analyses have repeatedly failed and why fiscal and monetary policies have been incapable of producing a sustained recovery. It explains why the global economy is slowing long term and becoming more unstable, why policies to date have largely failed the trend, and why the next crisis may therefore prove even worse than that of 2008-09.
Book plus DVD and Powerpoint slideshow
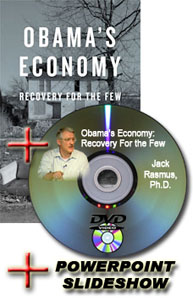
(Click on image) Obama's Economy: Recovery for the Few, explains how the weakest and most lopsided economic recovery since 1947 has been the direct outcome of failed economic policies of the Obama administration and US Federal Reserve bank since February 2009. Includes a detailed 'alternative program' in the final chapter. Includes the book, a video DVD presentation, and 66-slide PPT slideshow.
Book

(Click on image) Obama's Economy: Recovery for the Few, explains how the weakest and most lopsided economic recovery since 1947 has been the direct outcome of failed economic policies of the Obama administration and US Federal Reserve bank since February 2009. Includes a detailed 'alternative program' in the final chapter.
Book

(Click on image) A theoretical analysis, with historical case examples, of origins, causes and future evolution of the recent--and continuing--economic crisis in the U.S. and global economy. Includes predictions in 2009 of the inevitable failure of Obama policies and more serious crisis to come, 2013-15.
Book

(Click on image) Seven specific reasons why economic recovery under Obama since 2009 has failed for all but the wealthiest few and largest corporations. The book spells out eight specific areas as an Alternative Economic Recovery Program.
Book

(Click on image) The War At Home: The Corporate Offensive From Ronald Reagan to George W. Bush, is a 534 page, extensively researched, nonfiction book that describes the evolution of corporate-government policies from 1980 to 2005 that have shifted more than a $1 trillion dollars a year, every year, from 90 million American middle and working class households to the wealthiest 10% and corporations.
Search
-
Join 450 other subscribers
Jack Rasmus Site: KYKLOS PRODUCTIONS
 Dr. Jack Rasmus @drjackrasmus
