Feeds:
Posts
Comments

COMMENTARY:  FOR TWO CONSECUTIVE YEARS DURING THE WINTER OF 2010-11 AND 2011-12 THIS WRITER HAS BEEN FOREWARNING THAT JOBS DATA REPORTED FROM NOVEMBER TO MARCH IS POSSIBLY DISTORTED BY LABOR DEPARTMENT STATISTICAL ADJUSTMENT.  THAT SAME SCENARIO–OF WINTER JOBS GROWTH OVER-ESTIMATION FOLLOWED BY SPRING-SUMMER JOBS CREATION RELAPSE–APPEARS TO BE EMERGING ONCE AGAIN. THE FOLLOWING ARTICLE, TO APPEAR SHORTLY ON PUBLIC BLOGS, EXPLAINS WHY THIS PATTERN HAS BEEN, AND CONTINUES TO BE, OCCURRING.

For the third time in as many years, jobs growth over this past winter 2012 once again shows signs of a major ‘relapse’ this spring and summer.  The Labor Department’s employment numbers released April 6, 2012 indicate a mere 120,000 new jobs were created in March, a number not even sufficient to absorb new entrants into the labor force for the month. This follows reports of more than 200,000 jobs created monthly since last December 2011.

If this latest, third major reversal in jobs creation were a one time occurrence, it could be attributed perhaps to real economic conditions simply shifting. But three years in a row every spring? That repetition means there is likely something more fundamental at work.

A year ago, during winter-spring 2010-11, this writer forewarned that the jobs recovery that was being reported during the winter 2010-11 would not be sustainable, and that job creation would collapse in the summer of 2011. And it did. (see this writer’s published articles: ‘The Truth Behind the December (2010) Jobless Numbers’, ‘Behind the February (2010) Jobs Numbers’, ‘March Jobs Numbers—A Contrarian View’, ‘Why March (2011) Jobs Gains Will Collapse This Summer’, and ‘The Predicted Job Collapse Now in Progress’, all of which are available on this writer’s blog, jackrasmus.com).

More recently over this most recent winter 2011-12, this writer once again warned that the real, raw jobs data reported by the Labor Department was showing a massive mismatch compared to the ‘statistically adjusted’ jobs data reported by the Department.  While it is reasonable to expect some degree of divergence between the raw, ‘statistically unadjusted’ jobs data vs. the ‘statistically adjusted’ data—the latter of which are smoothed out based on assumptions of seasonality, new businesses formed, and other manipulations of the raw, actual jobs data—nevertheless the mismatch between the actual jobs numbers and the statistically adjusted numbers this past winter revealed a massive, extraordinary gap between the two.  (see this writer’s more recent published pieces, ‘Those Peculiar January (2012) Jobs Numbers’ and ‘The US Jobs Crisis—The Bigger Picture’, also available at jackrasmus.com).

For example, this past winter, the ‘gap’ between the decline in raw, actual (statistically unadjusted) jobs and the statistically adjusted jobs numbers between November-December 2011 showed a ‘net swing’, or difference between adjusted and unadjusted, of about 430,000 jobs.  That was not unreasonable. But over the period December 2011-January 2012, the U.S. labor department reported a statistically adjusted gain of 243,000 jobs in January 2012, whereas the raw actual jobs numbers showed an actual decline of –2.7 million jobs.  That ‘net swing’ of nearly 3 million jobs, more than seven times greater than of the preceding November-December period, is unprecedented. That kind of massive gap between declining actual job creation and statistically adjusted, reported job increases requires an explanation. However, the media seemed simply to accept the 243,000 jobs created in January without question.

A corroborating further example is what also happened to the U-6 unemployment rate over this past winter 2011-12: The November to December 2011 U-6 jobless rate showed a ‘gap’ between raw data and adjusted data of only 112,000 jobs. That was reasonable. But the December-January the gap ballooned to a ‘gap’ or net swing of more than a million jobs difference between the actual vs. statistically adjusted jobless numbers. That’s a tenfold difference.

Something is going on, in other words, with the statistical adjustment methodology employed by the labor department to estimate jobs in the winter months and the first quarter of each year. The jobs creation numbers reported by the labor department between each winter the past three years are simply grossly overstated.  That overstated thereafter appears to end come late spring-summer and the jobs numbers, even the statistically adjusted numbers, in turn collapse. This has happened now three years in a row. That means the gains of the past winter will likely again, for a third, time fade during the summer and third quarter of this year.

In this writer’s earlier articles, 2010-11, identifying this trend, it was suggested that at least two of the labor department’s statistical operations—the winter seasonality adjustments and the department’s additional, and grossly inaccurate, assumptions and methodology for estimating ‘new business formation’ (that raise the estimate of jobs created from new business formation)—are seriously deficient. Those methods and assumptions, in other words, may be based on conditions that pre-dated the current unique and qualitatively different and more severe ‘Epic’ recession conditions. These out of date methodologies may well be resulting in gross overestimation of adjusted job creation at certain times of the year (fourth and first quarters) and perhaps even underestimation at other times (second and third quarters). If so, what appears as volatility—gains in the winter and losses of jobs in the summer—may obscure what is essentially stagnant job growth throughout the year during the past three years.

It is also possible that the volatility in job creation may not be all statistical adjustments. It may be due as well to business cautiously hiring at the start of their fiscal years and then not continuing to hire further as the year progresses as it becomes clear, once again each year, that consumers do not have the income to sustain their consumption. Household real income growth for the ‘bottom 80%’ one hundred million or so households has declined steadily since 2009, and has been negatively impacted every spring by speculation-driven oil price hikes every spring the past three years. So too has spending by the wealthiest 10% households, whose buying is largely driven by the stock market. Stocks the last three years have surged in the Fall to Spring period, driven by free money pumped into the economy as a result of the Federal Reserve’s ‘Quantitative Easing’ programs. Those programs for three years ‘run out’ by the spring, the stock market stalls, and the wealthiest households pull back their spending as well.  Like jobs, general economic recovery has also entered a ‘relapse’ in the summer-third quarter in 2010 and 2011. Thus both the economy and jobs are locked in a ‘stop-go’ scenario since 2009.

What all that also means is—notwithstanding a winter economic and jobs resurgence the past three years—there really isn’t, nor has there been, any sustainable job creation of any consequence for the past three years. Jobs aren’t declining in great numbers. Nor are they growing. We are ‘bouncing along the bottom’—both in terms of jobs and the economic recovery in general.

The three economic recovery programs of the Obama administration, introduced in early 2009, late 2010, and now in 2011-12, have not fundamentally resolved the jobs crisis. Nor have they been able to get the economy on a sustained growth path.

This fundamental stagnation in the jobs markets, and the general economy’s trajectory of  short shallow recoveries followed by brief ‘relapses’, is all the more amazing given that more than $1.5 trillion in tax cuts introduced by the Obama administration over the course of its three economic recovery programs since 2009. Another $1.5 trillion occurred in the form of government  spending (mostly subsidies to the states, unemployed, and long term infrastructure projects that haven’t gotten off the ground) since 2009. In addition, more than $9 trillion pumped into the banks and stock and bond markets by the Federal Reserve.

This more than $12 trillion in total fiscal-monetary stimulus has resulted in large corporations accumulating a reported ‘cash hoard’ of more than $2.5 trillion. They have committed little of that to investment and job creation in the US. What was once termed ‘trickle down’ has become a ‘drip-drip’ investment-job creation process. More and more subsidies to corporate America (banks and non-banks) is producing less and less results in terms of US-based investment and job creation. Some job creation is occurring, but when that minimal job creation is contrasted to the massive, $12 trillion of stimulus of the past three years, it becomes clear that economic recovery programs, and related fiscal-monetary policies, are today essentially broken.

To the extent jobs are being created at all, it is heavily skewed toward lower paid temp, part time, and ‘two tier’ wage jobs. Both Obama and Corporations are making a big deal about jobs being brought back to the U.S. by the big Multinational Corporations, like General Electric and General Motors. But the relatively small flow of such jobs are at half pay and often with no benefits. Check out GE’s vaunted job creation at its Kentucky plant. And GM’s alleged new jobs in Detroit. New hires at both are paid $14 an hour, about half that of other workers, with less if any equivalent benefits.

And how many jobs in recent years have really been created in Manufacturing in general, and in Autos in particular?  When the recession started in December 2007, there were 13.9 million jobs in manufacturing in the U.S, and 978,000 in autos, according to the Labor Department’s B-1 Table of Employment. In July 2009, at the official end of the recession, there were 11.9 million manufacturing jobs and 640,000 auto jobs. This past March 1, more than four years after the start of the recession and approaching three years since it was officially declared ‘ended’, there are 11.7 manufacturing and 751,000 auto jobs. In other words, more than a quarter million auto jobs were lost since the recession started and less than half, 110,000, have been recovered (paying half pay remember!). And more than two million manufacturing jobs were lost since the start of the recession and the number of manufacturing jobs today is still less by 100,000 today than when the recession officially ended three years ago!

To conclude, after three years and three repeated false job recoveries the outlook for a sustained jobs growth today is once again in decline.  The fiscal-monetary policies of the past three years have not resurrected the jobs market in any sustained way, any more than they have succeeded in restoring the housing market or helping homeowners in foreclosure or have in any way stabilize state and local governments’ finances.

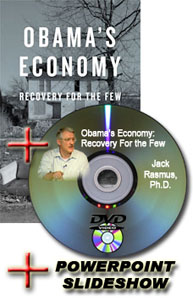
As this writer points out in his new book ‘Obama’s Economy: Recovery for the Few’,  there has never been a recovery of the economy from recession since 1947 without a sustained recovery of jobs, without the housing sector leading the recovery, and without state-local government increased spending on jobs and services.

So long as current economic recovery policies focus on more tax cuts for business and investors, on more subsidies for corporations, more free trade, more deregulation, and more deficit cutting for the rest of us—there will be no sustained recovery. It will at best result in a continuation of the ‘stop-go’ economy of the past three years that is the defining characteristic of today’s on-going ‘epic’ recession.

Jack Rasmus

Jack is the author of the just released book, ‘Obama’s Economy: Recovery for the Few’, published and distributed by Pluto Press and Palgrave-Macmillan and the 2011 ‘An Alternative Program for Economic Recovery’. His website is: www.kyklosproductions.com and blog, jackrasmus.com, where the above referenced articles on jobs are available.

INTRODUCTORY COMMENTARY:

LATER THIS MONTH, APRIL 2012, THIS WRITER’S MOST RECENT BOOK—“OBAMA’S ECONOMY: RECOVERY FOR THE FEW”—WILL BE AVAILABLE IN BOOKSTORES. THE BOOK IS AN ANALYSIS OF THE OBAMA ADMINISTRATION’S THREE ECONOMIC RECOVERY PROGRAMS INTRODUCED IN 2009-2011 AND RELATED FISCAL-MONETARY POLICIES OF THE PAST THREE YEARS.

THE BOOK ADDRESSES THREE QUESTIONS:

· WHY HAS THE RECOVERY BEEN THE WEAKEST ON RECORD SINCE 1947
· WHY HAS IT BEEN THE MOST ‘LOPSIDED’, BENEFITING MOSTLY BANKS, CORPORATIONS, INVESTORS, CEOs, AND THE WEALTHIEST HOUSEHOLDS
· AND WHY HAVE MORE THAN $12 TRILLION IN TAX CUTS, GOVERNMENT SPENDING, AND FEDERAL RESERVE ‘FREE MONEY’ TO BANKS RESULTED IN ONLY AN UNSUSTAINED ‘STOP-GO’ RECOVERY?

THE BOOK CONCLUDES BY OFFERING AN ALTERNATIVE PROGRAM FOR RECOVERY TO THE POLICIES OF THE PAST THREE YEARS.

THE FOLLOWING ARTICLE IS THE FIRST OF A FOUR PART ESSAY THAT SUMMARIZES THE ABOVE MAJOR THEMES OF THE BOOK.

· PART 1 DOCUMENTS HOW OBAMA’S ECONOMY HAS BEEN THE WEAKEST RECOVERY ON RECORD SINCE 1947
· PART 2 TO FOLLOW WILL DOCUMENT TO WHAT EXTENT THE PAST THREE PLUS YEARS HAVE BENEFITED THE WEALTHY AND THEIR CORPORATIONS.
· PART 3 WILL UPDATE THE BOOK’S THEMES BY EXAMINING WHAT HAS HAPPENED TO THE US ECONOMY SINCE NOVEMBER 2011. IS A RECOVERY FINALLY REALLY UNDERWAY, OR ARE WE IN YET ANOTHER, A FOURTH, STOP-GO SCENARIO?
· PART 4 WILL OFFER AN ANALYSIS WHY FISCAL-MONETARY POLICIES HAVE FAILED TO RESULT IN A SUSTAINED ECONOMIC RECOVERY IN THE U.S. SINCE 2007 AND WHY THEY WILL STILL CONTINUE TO DO SO AFTER THE UPCOMING NOVEMBER 2012 ELECTIONS.

(The first three parts of this series are combined in an article, ‘Obama’s Economy: The Limits of Economic Recovery’, that will appear in the May 1 Issue of ‘Z’ Magazine).

Part 1

Since January 2009 the U.S. economy has been mired in the weakest, most lopsided recovery on record since 1947. It has limped along the past three years in an historic ‘stop-go’ trajectory, during which two brief, shallow recoveries were followed in the summer of 2010 and again in 2011 by two short economic ‘relapses’—the latter defined as a condition where momentum toward recovery fails and the economy falls back to near stagnant growth in key economic sectors.

After two weak recoveries and two subsequent relapses, since last November 2011 the economy has been undergoing yet a third brief, shallow rebound. Although hyped by the media and public officials, this current ‘third recovery’ is limited once again only to certain sectors of the economy and is being driven by forces that are temporary and cannot be sustained. The ‘stop-go’ trajectory—characteristic of the US economy since early 2009—has therefore not been fundamentally checked or reversed. The economy remains on a path that will experience yet another relapse, or possibly an even worse double dip, sometime no later than 2013—as this writer previously predicted last January.

Forty-five months after the start of the current recession in December 2007, the U.S. economy as of October 2011 was therefore no larger in terms of GDP than it was in late 2007. In other words, nearly four years after the recession began there was no net additional economic growth. The net growth of the economy over the past four years was 0%. After nearly four years the economy was merely back where it began.

Repeated economic relapses since 2009 indicate an inability of the economy to achieve a sustained recovery. This failure to achieve sustained recovery stands in stark contrast to the 11 previous recessions that have occurred in the U.S. since 1947, the worst of which took place in 1973-75 and 1981-82. According to U.S. Commerce Department data, 45 months after its start of the 1973-75 recession the U.S. economy had grown by 15.95%, or at a rate of 4.25% per year. Similarly, 45 months after the start of 1981-82 recession, the economy had grown by 13.65%, or at a rate of 3.64% per year. Another way to illustrate the historic weakness of the current recovery is to consider the rates of annual GDP growth for the two non-recession years following the end of each of the three recessions: 1976-77, 1983-84, and 2010-11. The following Table 1 provides the comparison:

TABLE 1
Percent Change in Gross Domestic Product After Recessions
Source: Bureau of Economic Analysis, Historical Table 1.1.1

1973-75 Recession   1981-82 Recession     2007-09 Recession

1976: 5.4% GDP           1983: 4.5% GDP           2010: 3.0% GDP
1977: 4.6% GDP          1984: 7.2% GDP            2011: 1.7% GDP

Once again the comparison is dramatic. The recovery the past two years has averaged barely 2% per year, after a fiscal stimulus of more than $3 trillion and monetary stimulus of more than $9 trillion. In contrast, prior recoveries from the two worst previous recessions averaged two and three times that. Furthermore, even the current 2% is a high-side estimate and is about to weaken further in 2012.

The Obama ‘recovery’ since 2009 has been the weakest of the 11 previous recessions on record not simply in terms of GDP growth, but the weakest in the three critical areas of jobs, housing, and state-local government. These three key areas have hardly participated at all in recovery since 2009. This fact in turn explains much of why the U.S. economy today still remains locked in a ‘stop-go’ trajectory and why another relapse is virtually guaranteed, or why an even more serious double dip recession in 2013 is increasingly possible.

For example, as of the official end of the recession in June 2009, there were a total approximately 25 million unemployed. After more than $3 trillion dollars in tax cuts and government spending by the Obama administration, today about 23 million are still jobless. That’s a cost of about $1.5 million per job. Since mid-2010 Obama has placed his bet on manufacturing, exports, and free trade to lead the jobs recovery. He put multinational corporation CEO, Jeff Immelt, in charge of his ‘Jobs Council’. Immelt delivered more free trade deals, more tax cuts for multinationals, and more deregulation of business as the latest ‘jobs program’. But manufacturing has not led a jobs recovery. There were 11,869,000 manufacturing jobs in the U.S. in June 2009; at year end 2011 there were 11,790,000 manufacturing jobs, for a net decline of nearly 80,000. So much for a manufacturing-driven jobs recovery.

The sad state of administration jobs creation program is illustrated by the recent misnamed JOBS (‘Jumpstart Our Business Start-Ups’) bill passed by Congress—a bill about jobs in name only and, in fact, a proposal for more business financial deregulation, more freedom for financial speculators, and more small business tax cuts.

In the housing sector, 3.6 million homes were foreclosed during the recession years of 2007 and 2008. Yet during the first three years of the Obama administration there were an additional 8 million homes foreclosed, with the number projected to rise by at least another million or more in 2012, according to the industry source, Realtytrac. While a couple dozen big banks got $9 trillion in bailouts from the Federal Reserve, 8 million homeowners facing foreclosure got nothing in mortgage principle reductions or else were given a pittance of less than $10 billion in temporary, partial interest rate reductions under the Obama HASP and HAMP housing programs introduced in 2009.

The Obama administration’s recent HARP 2.0 is another handout to the big 5 bank mortgage lenders. HARP is supposed to require mortgage lenders to refinance principle owed by homeowners with mortgages in ‘negative equity’, something the lenders have successfully blocked for three years now. In exchange for doing so, the Obama administration has forced States’ attorneys general to accept a $26 billion ‘cap’ on legal suits pending against the mortgage lenders arising out of the 2010 ‘robo-signing’ housing scandal where millions of homeowners were illegally foreclosed and thrown out of their homes by the banks. But HARP is already being gamed by the banks. As they put aside funds for refinancing negative equity mortgages, they are raising mortgage interest rates and fees on all non-negative equity mortgage applications to cover the cost of the negative equity refinancings. In other words, charging non-negative equity homeowners more to pay for the negative equity homeowners. Immediately upon announcement of HARP, mortgage rates began once again to rise, thereby dooming any nascent housing recovery.

In the previous worst recession in the 1970s and 1980s, the loss of jobs in the private sector were offset by hiring by state and local governments, thereby dampening the depth and duration of the recession and accelerating the recovery process. In contrast, since June 2009 state and local government has not only not increased hiring to offset private sector job loss, but has itself become the biggest contributor to job loss. From June 2009 through 2011 the number of state and local government workers declined by more than 640,000—most of them teachers.

The answer to the question previously posted—i.e. why has the Obama recovery been so short and shallow, so uncertain, and characterized by repeated relapses—can be explained in large part by the failure of Obama policies to address jobs, housing, and state-local governments. There have been three distinct economic recovery programs introduced by the Obama administration—in early 2009, late 2010, and late 2011. The fact that a third has been introduced in the past six months is testimony to the failure of the first two. But none of these three programs have resulted in a rapid recovery of jobs; none have resolved the foreclosure mess and continuing veritable depression in housing; and none have succeeded even remotely in stabilizing state and local government finances that would prevent layoffs, cuts in services, or rising local taxes and fees.

The importance of jobs, housing, and state-local government spending to recovery is evident by the fact there has never been a recovery from any recession since 1947 without increased spending and hiring by state and local government; without the housing sector recovery leading the way; or without job creation averaging at least 400,000 to 500,000 each month for at least six consecutive months.

The logical question of course is why has there not been a sustained recovery thus far—after more than $1.5 trillion in federal government spending since early 2009, after more than another $1.5 trillion in tax cuts, and after the Federal Reserve, the central bank of the U.S., has pumped in more than $9 trillion in virtually ‘free money’ into the banks (by purchasing at full price mortgage and other bonds worth pennies on the dollar and after lending banks all the money they can carry away at a mere 0.1% to 0.25% interest rates)?

The answer to the question is that a pittance of the cumulative $12 trillion of fiscal and monetary stimulus since 2009 has ‘trickled down’ to job creation, to stopping foreclosures or stimulating the housing sector, or to increase state-local government spending. What was once called the ‘trickled down’ economy in the U.S. in the past has basically changed since 2008. It has become, at best, a ‘drip-drip’, leaky faucet economy, with most of the $12 trillion spent by Congress and the Federal Reserve having been siphoned off by large multinational corporations and the big 19 banks, by speculative investors manipulating commodity, oil, and currency markets, by CEOs, hedge fund, and private equity managers ensuring huge personal income gains for themselves, and by the wealthiest 10% of households in the U.S., about 1 million of the approximate 130 million households in the U.S., reaping the harvest of record stock and bond market expansion set in motion by trillions of dollars of Federal Reserve free money.

Jack Rasmus, April 3, 2012

Jack’s book, Obama’s Economy: Recovery for the Few, is published by Pluto Press and Palgrave-Macmillan. It is available online April 1 at Amazon and from the author’s website, http://www.kyklosproductions.com, and his blog, jackrasmus.com

COMMENTARY: THE EUROPEAN CENTRAL BANK, THE ECB, IN THE PAST FEW DAYS PUMPED ANOTHER $1 TRILLION OR SO INTO THE EUROPEAN BANKING SYSTEM, AN INDICATION THAT THE SO-CALLED EURO DEBT CRISIS IS FUNDAMENTALLY A EURO BANK CRISIS. THE ECB IS FOLLOWING IN THE FOOTSTEPS OF THE US FEDERAL RESERVE, THE BANK OF ENGLAND, AND THE BANK OF JAPAN: ALL HAVE PUMPED TRILLIONS INTO THE GLOBAL BANKING SYSTEM TO PREVENT A SECOND GLOBAL BANKING CRISIS. BUT THE CONSEQUENCES OF “FREE MONEY” IS A GROWING ADDICTION BY THE BANKS AND EVEN NON-BANKS ON THAT FREE MONEY, A REPEATED STOCK AND COMMODITY BUBBLES CYCLE, AND COMMODITY INFLATION (ESPECIALLY OIL) THAT LOWERS REAL INCOMES FOR HUNDREDS OF MILLIONS OF HOUSEHOLDS, CONSTRAINS CONSUMPTION GROWTH, AND PREVENTS A SUSTAINED ECONOMIC RECOVERY.


Growing sectors of Capital are becoming addicts—dependant on virtually free money from central banks, from Europe to the USA to Japan. That means, in particular, banks, financial intermediaries, stock market and commodities institutional speculators, and even a growing segment of non-bank corporations.

Since 2008 the US central bank, the Federal Reserve, has pumped more than $9 trillion into the banking and financial system to prevent it from collapsing. It has done this at great cost, however. The trillions of dollars of liquidity injections from the Fed have not eliminated the original problem that that liquidity was supposed to resolve: i.e. removal of the bad assets on financial balance sheets. Those bad assets still remain for most part, especially for institutions like Citigroup and Bank of America that – were it not for phony bank stress tests and suspension of normal accounting rules since 2009 – would be technically bankrupt today. The Fed has not ‘removed’ those bad assets, which have only in part been written off as losses; the Fed has merely mirrored them by adding them to its own balance sheet. In so doing, it has bought some time. But that is all. It has not resulted in sustained recovery of the US economy in any real sense.

For the past three years since February 2009, the Obama administration and supporters have argued that the Fed’s $9 trillion bailouts would generate recovery for the rest of the U.S. economy. But in this objective, it has clearly failed. Except for stock and bond markets, large company corporate profits, CEOs pay and bankers’ bonuses, and the wealthiest 10% households, nearly all economic indicators today still remain below their level when the recession began. And some indicators—especially jobs, housing, and local governments’ finances—are significantly below pre-recession levels.

The Fed’s virtually zero interest loans to banks, and its more than $2.7 trillion in direct purchases of bonds from the private financial sector using printed money (called ‘Quantitative Easing’ or QE), has not revived the economy. What that massive injection of liquidity to banks and investors has accomplished is a hand-stuffing of the capitalist goose with free money. That liquidity has financed stock and commodity market booms, that in turn have provoked inflation which reduces the real incomes of a 100 million US working and middle class households. That process, moreover, has occurred on three separate occasions in the US since 2008.

There have been three stock and commodity market booms since 2008. Remember gas prices hitting nearly $5 in the spring of 2008, then again in the spring of 2011, and now once more this spring 2012? Stock market and commodity price boomlets accompanied the massive liquidity injections during each of those same periods. Both stock market and commodities booms, and the resultant inflation, were immediately ‘fed’ by the Federal Reserve’s QE policies: The 2008 event was highly correlated with the Fed’s bailout of Bear Stearns and rescue auctions of the shadow banks in 2008. The 2010 stock-commodity boom was similarly set off by the Fed’s QE1 $1.75 trillion direct bond purchases and zero interest loans to banks in 2009. When the QE1 bond buying stopped in late spring 2010, the stock and commodity markets immediately collapsed. When the Fed announced another $600 billion QE2 in the fall 2010, the stock-commodity booms took off again in late 2010 and into the spring of 2011. When that QE2 buying binge finished in late spring 2011, the stock-commodity markets quickly fell back once again. Banks and investors once more demanded another round of Fed bond buying and free money. That led to the Fed’s ‘operation twist’ bond buying in late 2011, as well as demands for even more generous QE3 money injection since late last year. With that, the stock market surged again from late 2011 continuing today into 2012. Highly correlated with all the QE1, 2 and 3 and free money have been three corresponding bouts of stock and commodity – especially oil – price expansion and speculation. In other words, there’s an almost perfect correlation between Fed monetary bailouts, QE, and zero loan policies ‘coming and going’ and corresponding stock and commodity speculation ‘stop-go’ since 2008 to the present.

Here’s how it works: The Fed pumps no cost money into the banks. The banks then loan it at 5%-10% to speculators like hedge funds, private equity firms, ‘dark pool’ stock buying consortia, and other institutional and wealthy individual speculators. The latter then funnel the money into large block stock purchases, into commodity futures, speculate with credit default swaps on Euro sovereign bonds in Greece, Spain, etc., further exacerbating those crises, or into currency speculation (one favorite: the Brazilian currency, the Real), Hong Kong and Chinese property, etc. Where the Fed money doesn’t go, however, is into loans to small and medium businesses in the US for which it was originally purportedly intended or to aid the recovery of the collapsed housing and commercial property markets in the U.S.

After three years, 2009-12, it appears the U.S. financial system is becoming increasingly addicted to this Free Money from the Fed, increasingly (QE) money printed by the Fed instead of traditional Treasury bond open market operations.

But when the Fed stops, the stock and commodity markets flop.

The fundamental question therefore: if the Fed ever permanently ceases providing free money, can the stock, commodity, and even bond markets function on their own any more without that prop of multi-trillions of dollars? And there’s a converse to all this, of even greater importance: what happens when the Fed tries to retrieve those trillions of free money by cutting off the free money and raising interest rates? If it takes the recent massive liquidity injection just to keep the Capitalist financial system barely functioning, what happens should the Fed try to retrieve that liquidity? The Capitalist system may be ‘super sensitive’ to attempts to slow an economy, as well as ‘super insensitive’ to attempts to stimulate an economy. What that means is that it takes an ever-increasing massive liquidity injection to keep the system from collapsing in a recession phase, but that it will take very little Fed shift from free money and raising interest rates to choke off a nascent recovery of the economy in an early expansion phase. Stated differently in economists’ parlance, this means the financial system today may have now become ‘liquidity and interest rate inelastic’ in efforts to stimulate recovery, but conversely ‘liquidity and interest rate elastic’ given attempts to slow a recovery.

This addiction is not limited to the US financial system. It appears to be spreading as well to the non-banking sector. Large corporations increasingly do not appear eager today to invest their massive earnings and cash now on hand, estimated at more than $2.5 trillion, nor even to distribute most of it to their shareholders. They prefer to hoard it. The super-cheap Fed money means they either borrow it, through their financial subsidiary if they have one, directly from the Fed, or borrow from banks at today’s super low interest rates. Or they issue cheap corporate bonds, take on more debt, and use the borrowed funds to buy back their company stock and pay dividends to their shareholders. In other words, they borrow money at the super low rates and pay themselves the unearned capital gains ‘profits’. They don’t have to ‘make’ profits; they just transfer the free money from the Fed to their shareholders.

Among smaller and medium sized businesses, the main ‘play’ is to issue a mountain of high risk, ‘junk bond’ debt on their companies’ assets. Often, they issue new junk bonds to roll over and payoff old junk bonds, compounding the debt on their balance sheets. Junk bond issuance hit record levels in 2010 and now again in 2012. But the junk bond booms are made possible by the Fed’s free money. Much of this junk bond debt is set to come due in 2013-14. But should interest rates rise, small-medium business defaults will almost certainly escalate to record levels for those non-financial companies now addicted, it appears, to junk bond debt.

Another way to look at the addiction to free or super low cost money is that it is being made available because banks, speculators, and even non-bank companies are increasingly unable to generate profits from traditional normal business activities. So the central bank in a crisis must spoon-feed them the money to prevent their collapse. Capitalist companies are less interested today in making money by making things than in turning speculative profits, based on Fed free money availability and by borrowing in lieu of real profits creation. Of course, there are exceptions—in emerging markets infrastructure investment, making cars and iPads in China, and so forth. But I’m talking here about a growing trend and growing apparent dependency—that is, an addiction.

And the phenomenon increasingly is not limited to the US economy today. We now see this same development and trend occurring in the Eurozone with the European Central Bank, ECB.

Late last year, as the Eurozone economy and financial system began approaching a crisis stage with Greece, Spain, Portugal, Italy, etc. and, beneath the surface, the private banking systems throughout Europe. To prevent a run on the Euro private banking system, the European Central Bank, ECB, embarked upon a strategy almost exactly like the U.S. Federal Reserve’s. Last week alone, the ECB pumped 530 billion euros, or $777 billion, into the banks at 1% interest. That follows a previous 489 billion euros injected late last year, i.e. another $700 billion. (Which followed another $500 billion in 2010). That’s a total of more than $1.5 trillion in just six months of virtually free money pumped into the euro banking system, no doubt in anticipation of bank failures occurring in the wake of the Greek and other European bond crises. That massive recent ECB injection has temporarily stabilized the banking system in the Eurozone, much as this writer predicted last December would happen. However, ‘temporary’ is the operative term here. It is not likely another such liquidity injection will occur prior to a string of bank collapses taking place first, given growing opposition by the Germans to the ECB ‘printing money’ like the Federal Reserve. Meanwhile, the Greek debt crisis will almost certainly erupt once again before year end 2012. And Spain and Portugal and other Euro periphery economies are not far behind. The point is: massive liquidity injections by central banks may temporarily stabilize a banking crisis, but not permanently. Furthermore, they do not result in economic recovery—and in ways actually serve to constrain that same general economic recovery by precipitating inflation and reducing consumption. Here’s how massive liquidity injections, ‘free money’, restrain recovery:

The massive liquidity injections now commencing in Europe, just as they have been in the US since 2009, have not to date resulted in the European economies avoiding recession. Nor will the Fed’s ‘free money’ prevent the coming of another recession in the US by 2013. Today’s European recession train has left the station and Europe is now well on its way toward a generalized downturn. It’s only a question of how deep and how long. That rapid Euro slowdown has already begun impacting the rest of the global economy, as exports to Europe from China, India, and Japan are now falling, in turn slowing growth in China, India, and the rest of the global economy. The European recession will also mean fewer US exports and a further slowdown of the U.S. economy as U.S. manufacturing pulls back, which is already underway. Contrary to business pundits and the Obama administration, there is no way manufacturing can lead the US economy to a sustained recovery this year, next, or ever!

The joint Federal Reserve and ECB massive injection of free money into the global economy will continue to set off stock and commodity price inflation worldwide. For the rest of us non-professional investors that translates into more inflation, which is already happening, as commodity prices like gasoline and food escalate in both Europe and the U.S. In the U.S. gasoline prices alone in some places rose by 40 cents a gallon in a matter of just two weeks last month. And that’s well before the spring take-off in gasoline prices kicks in. That inflation means a further fall in household income, already declining for the past three years, less consumption in turn, more household credit card spending to try to make up for it, and especially severe stress on retiree fixed income households. It will also mean the recent passage of the extension of the payroll tax cuts will be largely absorbed by the oil companies—just as half of the same payroll tax cut in 2011 was absorbed by rising gas prices. The overall consequences for the US economy in turn later this year could prove negative.

To sum up, a real question remains whether the global capitalist system today, in particular in the northern tier of Europe, North America, and Japan—can function any longer as it once had. It may have become so addicted to, and so dependent upon, free central bank money, that it is questionable whether it can wean itself off that ‘fire hose’ injection of free money. Europe looks much like the US now in that regard, and both look very much like their predecessor capitalist invalid, Japan.

Like true addicts, attempts at some point to return to pre-crisis arrangements may result in such severe ‘withdrawal symptoms’ that the US and Euro economies may rapidly contract at the first attempt to shake the addiction. Going ‘cold turkey’ could result in a more severe economic contraction and recession than even that experienced during the 2007-09 initial downturn. Some form of ‘monetary methadone medical’ injection may have to continue. The patient may prove permanently in need of assistance—paid for by the rest of the economy. That means us. It also means more or less permanent ‘austerity’ blood transfusions. But blood transfusions cannot go on indefinitely. As some point the donors will shout, ‘I’m not going to die’ to save them and will tear off the hyperdermic needle.

However, before that occurs, in the interim the Eurozone’s current massive money injection by the ECB to the euro banks, and the U.S. Federal Reserve’s continuing liquidity injection to US banks, will no doubt continue. Continuing as well will be repeated stop-go cycles of stock market and commodity bubbles that stifle economic recovery, gasoline and food price inflation, further pressure on real incomes, hesitant consumption spending, and weak, unsustained economic recovery.

Jack Rasmus

Jack is the author of the forthcoming, April 2012 book, OBAMA’s ECONOMY: RECOVERY FOR THE FEW, Palgrave-Macmillan (US) and Pluto books, (UK). His website is http://www.kyklosproductions.com and his blog, jackrasmus.com

COMMENTARY: THE FOLLOWING ENTRY REPRESENTS A FORAY INTO COMMENTARY ON THE CURRENT GREEK DEBT CRISIS AND THE RISING DIRECT OPPOSITION IN THE STREETS OF GREECE TO EFFORTS BY BANKERS AND POLITICIANS TO MAKE THE GREEK PEOPLE PAY FOR THE CRISIS. PARALLELS BETWEEN GREECE TODAY, AND THE US AUSTERITY PROGRAM TO COME IN 2013 IMMEDIATELY AFTER THE NOVEMBER US ELECTIONS, ARE MADE

The crisis in Greece is not a ‘sovereign, or government, debt’ crisis. That’s the surface appearance of the problem. The below the surface struggle is about how bankers, bondholders and speculators–together with their politicians in government–can offload the cost of bad assets they created onto the shoulders of the Greek people. It’s about ‘who’s going to pay for the bad assets’.

The news coming out of Greece, reported in the western press, is that the big boys of northern Europe, US, and their hedge fund-banker buddies, are willing to ‘take a hair cut’ and lose 70% of the value of their existing bonds. But the real facts are that 70% reduction includes only 30% of the current bonds that have become ‘bad assets’. No mention is made in the press of the other 70% of bonds that are not required to take a loss.

The reported Greek debt is somewhere between $300-$400 billion. The current ‘loan’ in question is about $170 billion. But the real Greek total debt is likely around $600-$650 billion. That’s just about the total on hand for the European bailout fund. (Total bailout that will be needed for all of the Eurozone is likely around $4 trillion, this writer estimates, to cover not only Greece but Portugal (next up for another $200 billion), Spain, Italy (more than a $trillion), as well as other ‘lesser economies’ also increasingly in trouble, such as Hungary, Austria, Belgium, and soon perhaps even economic stalwarts like Norway, whose housing bubble is now about to burst.

In other words, the Greece and overall Eurozone debt crisis is far from over and has a long course yet to run. That means little Greece’s problems are also far from over as well. As they say, ‘you ain’t seen nothing yet’.

If you want to see what a bona fide economic depression in the 21st century looks like, look at Greece. One out of two youth unemployed. General unemployment in excess of 25% (the worst year level in the US in the 1930s). GDP collapsing. Pensions shrinking. Jobs melting away at an increasing rate. And the bondholders-bankers behind the Germany-French and other Euro governments want the Greek people to pay for something they didn’t create. They want the people to cover the lion’s share burden of making up for their bad assets.

Greece is also a good example how an economy cannot ‘austerity its way to recovery’. Cutting incomes of those whose spending make up the overwhelming majority of the economy is not a path to recovery–as Obama and Congress will soon find out in 2013. Already the $2.2 trillion US deficit cuts mandated in 2011, which are scheduled to take effect AFTER the upcoming November 2012 national elections, will slow the US economy to a less than 1% GDP growth. Those aren’t my numbers; they’re the cautious Congressional Budget Office’s numbers. And that less than 1% growth is BEFORE Congress and the next president (doesn’t matter who) set to work cutting another $4 trillion immediately after the elections. That’s when the real US deficit cutting crunch will start–and the next double dip of the US economy.

Obama and Congress will discover what an ‘austerity recession’ is, come 2013. In that they will join Japan and most of western Europe, including the French and the British. Austerity, or deficit-budget cutting, only makes a debt crisis worse. Dont’ believe me, ask the Greeks!

There are only two ways to get out of deep debt-driven economic contraction that remains ‘systemically fragile’ today across the board. I’m talking about both the US and the Eurozone, as well as Japan. One way is to reflate the economy by generating inflation. The other is to liquidate the bad assets.

The Federal Reserve has done a horrible job at reflating the economy. The trillions it has spent on bailing out the banks, printing money, buying banks and mortgage lenders’ bad subprime loans at near full purchase price instead of the real 15 cents on the dollar they are worth, has led not to inflation in product prices (that would stimulate investment) but instead resulted in the Federal Reserve spoon-feeding speculators around the globe. The Fed has pumped up stock markets, real estate, currency speculation and volatility, oil and commodity prices, and financial securities in general. The money and credit from the Fed has not gotten to those parts of the economy that need it most. The Fed is not broke. It can always print money. It’s just that Fed policy is itself broken.

The other option is to ‘liquidate’ the bad assets. That too the Fed and the Obama administration have sadly failed at. The essence of the Fed-Obama bank bailout strategy since 2009 has been to ‘rescue’ the banks–not by removing the bad assets from their balance sheets but just by pumping liquidity into these zombie institutions (many of which have been technically insolvent and bankrupt now for years), to in effect ‘offset’ the bad assets on their balance sheets. The bad assets are still there. The Fed and Congress have not only just ‘offset’ the bad assets on the private balance sheet, but have in so doing mirrored those bad assets on the public balance sheet side. So it not only failed to remove (liquidate) the bad assets; it doubled them. Now the public sector has become as ‘fragile’ as the banking sector. But liquidation, you see, is abhorred by the bankers and bondholders. They don’t want their asset values ‘reduced’ or expunged. They want the people to pay for the losses. And that, once again, is Greece today–and the USA come 2013 and beyond.

Jack Rasmus
For an ‘Alternative Program for Economic Recovery’ that makes bankers and bondholder-speculators pay for the losses on their bad assets, see Jack’s program by the same title on his website, http://www.kyklosproductions.com, accessible from the right side of this blog page.

COMMENTARY: LAST WEEK’S JANUARY JOBS REPORT FROM THE LABOR DEPARTMENT HAD SOME VERY PECULIAR AND STRANGE NUMBERS, INCLUDING A MASSIVE UPWARD REVISION OF 3 MILLION JOBS DUE TO SEASONALITY ASSUMPTIONS. WAS THERE REALLY 243,000 ACTUAL (REAL) JOBS CREATED LAST MONTH, OR WAS IT LARGELY STATISTICAL LEGERDEMAIN? HERE’S SOME QUESTIONS RAISED ABOUT THE NUMBERS. (What follows is somewhat ‘wonkish’ but for those interested, do read on).

‘Those Peculiar January Jobs Numbers; Or, When 243,000 Jobs Aren’t’ by Jack Rasmus, copyright 2012

The January 2012 jobs report released by the US Labor Department on Friday, February 3 indicated that 243,000 new jobs were created in the nonfarm sector of the US economy last month. Additionally, the U-3 unemployment rate fell from 8.5 to 8.3%. How real are those numbers? Are they actual jobs created? Whats the true unemployment rate?

First, it is important to note that the 243,000 January jobs numbers are not the actual jobs created. They represent seasonal adjustments made to the raw data for jobs, referred to as the not seasonally adjusted jobs tally for the month. The January jobs report reflects an anomalous massive upward revision of the raw jobs data, due to assumptions about seasonality and new business formations.

Lets look at trends from November 2011 through January 2012 for both the seasonally adjusted and not seasonally adjusted for purposes of comparison.

The actual (not seasonally adjusted) jobs numbers for November 2011 show there were 133.179 million nonfarm jobs in the US economy that month. The following month, December 2011, total nonfarm jobs had declined to 132.952 million, for a decline of 227,000 jobs. That makes sense, given that 203,000 jobs were lost in construction, which is typical for Decembers, while 74,000 jobs were reduced by states and another-72,000 by cities and schools that month. Offsetting the construction-public sector job losses were 142,000 jobs added in Retail, mostly department stores, which also makes sense given the holiday season. Manufacturing and other service sector jobs changed little, some up and some down slightly over the month. Again, these are the not seasonally adjusted jobs for November.

What about the seasonally adjusted jobs numbers for November? One would expect some differences in numbers here, of course. Lets look. Total nonfarm jobs increased in November, by 203,000 instead of declined (per the not adjusted numbers) by 227,000. That represents a net difference and swing of 430,000 jobs.

Now lets make a similar comparison of seasonally adjusted and not seasonally adjusted for jobs between December 2011 and January 2012 that were reported on February 3, 2012 for last month. What appears is an incredible 7 to 10-fold increase in the difference between seasonally adjusted and not seasonally adjusted.

The not seasonally adjusted, raw jobs numbers show a loss of jobs for January 2012, after the holiday season, of 2.7 million jobs. That includes about 300,000 construction jobs, which is not strange given the mid-winter slowdown typical of this sector. Plus another 600,000 jobs in retail, which makes sense after the typical holiday sales hiring surge typical in November-December. And another 400,000 in business professional services as most businesses trim their labor force at the start of the year to keep costs down and to watch when and where to add jobs back in the subsequent months. However, the adjusted, upward revised numbers for January showed a gain of 243,000 jobs instead of the unadjusted 2.7 million fewer jobs. That 243,000 gain in jobs includes adding construction jobs in mid-winter, and adding even more jobs176,000in Retail and Services after the holiday season hiring surge. This retail-services job gains for January occur, moreover, despite the dismal retail sales holiday season when, except for autos, retail sales actually declined by 0.1% compared to the previous year. Why would retail employers add jobs after that poor sales season? Why would they not reduce the huge numbers of part time and temp hires of November-December in January, as they typically do after the holidaysespecially given the poor retail sales performance? And why would the construction sector add jobs in mid-winter? And why would business professional sector companies add 1.1 million jobs, according to the seasonal adjustment assumptions, instead of trimming jobs, as reflected in the unadjusted numbers? In other words, why would professional-business services not make their typical beginning-of-the-year labor force temporary reductions?

It is interesting to note that instead of a net swing between the seasonally adjusted-not seasonally adjusted numbers of 430,000, as occurred during November-December, we get a net swing, or difference, between seasonally adjusted vs. not adjusted of nearly 3 million jobs for December-January? Does this make sense? One would expect major differences between seasonally adjusted-not seasonally adjusted numbers. But a seven-fold increase in the difference from month to month–from 430,000 to 3 million–is not credible.

Lets look at this massive difference and net swing anomaly from another perspective: the unemployment numbers. To start, forget about the U-3 unemployment number preferred by the press, with its reported reduction in unemployment rate from 8.5% in December to 8.3% in January that the administration and press have been hyping. The more accurate U-6 unemployment rate is a better indicator since it accommodates part time, discourage workers, and underemployed workers. It too underestimates true unemployment by about another 2%, per this writers calculations, but not nearly as dramatically as the U-3 number.

In December the U-6 unemployment rate for 15.2%, both for not seasonally adjusted and seasonally adjusted total employment. That means, for the unadjusted employment levels there were 20.208 million jobless in December 2011 and 20.096 million unemployment in December per the seasonally adjusted numbers. Thats a difference of only 112,000 unemployed.

But look at the December-January difference in unemployed between the two sets of numbers: The U-6 unemployment rate for seasonally adjusted fell to 15.1% in January (from 15.2%) in December, while the not seasonally adjusted number of unemployed rose from 15.2% in December to 16.2% in January. The U-6 indicates the number of unemployed rose, which makes sense for construction, retail, and other sectors per the preceding argument. But for the seasonally adjusted numbers, unemployment declined for the U-6 by 0.1% (and 0.2% for the U-3). The net swing between the two sets of data for December-January was 1.108 million, compared to the net swing for November-December of only 112,000. The difference represent a ten-fold jump for December-January.

How can the seasonally adjusted vs. not seasonally adjusted jobs numbers be so large for December-January compared to previous months? How can what appears to be a decline in jobs clearly in January end up reported, after seasonality and other statistical adjustments, as an upward revised 243,000 jobs?

Other economists have been focusing on the possible problem with the seasonality assumptions in the January jobs numbers this past week, but their commentary is not reaching the public press. The essential point is that the January jobs report is peculiar, and requires an explanation by Labor Department statisticians why there was a swing of about 3 million jobs last month between the raw jobs numbers data and the upward revisions in the seasonally adjusted numbers for the month.

Jack Rasmus

Jack is the author of An Alternative Program for Economic Recovery, available at his website, http://www.kyklosproductions.com, and the forthcoming April book, Obamas Economy: Recovery for the Few, by Pluto Press-Palgrave.

COMMENTARY: THE HYPE IS ON AGAIN IN THE PRESS THAT RECOVERY IS AROUND THE CORNER. LAST MONTH’S JOBS NUMBERS ARE CITED AS THE LATEST PROOF OF RECOVERY. THE ECONOMIC DATA PUFFERY WILL NO DOUBT PROVE INTENSE IN THE COMING MONTHS, IN THIS ELECTION YEAR. BUT A CLOSER LOOK AT THE FACTS SHOULD TEMPER THE FALSE CONFIDENCE. LAST WEEK’S JOBS NUMBERS WILL BE ADDRESSED IN AN ANALYSIS TO SHORTLY FOLLOW. IN THE MEANTIME, A BROADER LOOK AT THE STILL ONGOING JOBS CRISIS IN THE U.S. IS ANALYZED IN THE FOLLOWING

“THE U.S. JOBS CRISIS–THE BIGGER PICTURE” by Jack Rasmus, copyright 2012

Despite last Fridays January 2012 Labor Department jobs report, more than three years after President Obama assumed office the crisis in jobs in the U.S. continues as the number one problem of the US economy. The seasonally adjusted official numbers may have indicated 243,000 jobs created last month, but the actual, raw data on jobs was dramatically different, as will be explained in a follow up analysis to this item on jobs in the U.S. economy. In the interim, for those readers inclined to get excited about January’s very short term jobs picture, to start here’s some more sobering facts on the bigger picture.

Based on the U.S. Department of Labors U-6 unemployment rate, at the official end of the recession in June 2009 there were 25.4 million jobless; By January 2012 more than 30 months later, there still remained 23.4 million without work. That’s a total of only approximately 67,200 jobs created a month over two and a half years–a monthly number barely half of what is needed to even absorb new entrants into the labor force each month.

Most of the two million jobs created in the private sector since Obama assumed office three years ago have been lower paid service jobs, part time jobs, and temporary forms of employment–all providing lower wages and few benefits. Higher paying and benefit jobs in manufacturing and construction have, in contrast, continued to decline since the June 2009 recession low-point. Today there are still 79,000 fewer jobs in manufacturing and 680,000 fewer jobs in construction than there were at the recession low-point of June 2009. There were 21.1 million manufacturing and construction jobs when the recession began in 2008. There are only 17.3 million manufacturing-construction jobs today.

Unlike all previous 11 recessions in the U.S. since 1945, the government sector has not created jobs to offset private sector job loss during the recession. Government instead has become a major contributor to job destruction. Local governments have laid off 643,000 workers since June 2009, nearly a quarter million247,000of whom have been teachers. Public workers and teachers continue to be laid off at a rate of 20,000 a month or more. At that pace, by the end of his first term, President Obama may have presided over a loss of nearly a million public workers’ jobs.

Other indicators of the continuing sad state of the jobs markets in the U.S. after three years further corroborate the continuing crisis of jobs in the U.S. For example, the duration of long-term unemployed–i.e. those out of work 27 or more weeks–has continued to rise steadily since June 2009 from 24% of all those unemployed to more than 40% today. Another indicator of the continuing severity of today’s jobs crisis, the Employment to Population Ratio that measures how well the economy is creating jobs in relation to the growth of population, shows the U.S. economy is growing fewer and fewer jobs as the U.S. population rises. In other words, we are not even keeping up with the population growth. At the start of the current recession 63% of the US population was employed; today only 58.5% of the U.S. population has jobs. Not least, the Job Opening to Labor Turnover (JOLT) ratio shows there are still today 4.2 workers looking for every job offered, i.e. well more than double the 1.8 to 1 ratio that existed before the recession began.

The Jobs Creation programs offered by the Obama administration and Congress over the past three years have proved dismally inadequate. In January 2009 the Obama administration promised to create 6 million jobs if its 1st stimulus program costing $787 billion were passed by Congress, 40% of which were tax cuts. In June 2009 there were approximately 25 million unemployed. By mid-summer 2010 there were still 25 million unemployed and job losses began to rise again that summer.

The Obama administrations answer was to propose even more tax cuts for corporations and investors, another $802 billion in tax cuts including a two year extension of the Bush-era tax cuts costing $450 billion. The administration then added another new twist to its jobs strategy in late 2010: it brought in corporate CEOs like Jeff Immelt of the General Electric Corp., and Bill Daley, a big banker, to run the Presidents new jobs council. Their corporate answer to a jobs program was more free trade agreements, an end to more business regulations, lowering corporate tax rates for offshore multinational companies hoarding their profits in foreign subsidiaries to avoid paying US taxes, patent law reform, and taking hundreds of billions in funds from social security to cut payroll taxes. That corporate-designed jobs program failed in turn as well.

Obama administration business tax cuts, its corporate friendly and job-destroying free trade deals, and its raiding social security to give workers with jobs a paltry tax cut at the expense of retired workers deferred wages have all failed to even dent the 23-24 million still unemployed. The stimulus and tax cut programs of the past three years have bailed out big business and big banks, but have not created jobs beyond a mere trickle. What was once a trickle down approach to job creation has become today a drip-drip policy.

While the Democrats have thus far failed to provide any effective programs to restore the millions of jobs lost since the recession began, Republicans continue to propose old retread solutions that destroyed millions of jobs over the past decade. Republicans continue to propose more tax cuts for corporations and wealthy investors, still more job-destroying free trade agreements, more cuts in social security-medicare-medicaid and other social programs, and a further expansion of defense spending. These programs not only have failed to produce jobs, but actually have eliminated them by the millions over the past decade.

The historical record shows that $3.4 trillion in Bush tax cuts, given mostly to business and investors, were associated with no job creation at all during his term. The number of private sector jobs when Bush came into office in January 2001 was 111,634,000. The number of private sector jobs when he left office in January 2009 was 110,981,000. The U.S. economy and taxpayer paid $3.4 trillion to lose 653,000 jobs. By December 2011, three years later and after another year extension of the Bush tax cuts, there were 109,928,000 private sector jobs. The more the Bush tax cuts, the fewer the jobs. Yet Republicans continue to beat their broken drum that tax cuts create jobs, when in fact there are still 1.7 million fewer private jobs in the U.S. than there were a decade ago.
Republicans further continue to chant for more cuts in social programs, when countless studies show it will result in the loss of millions more jobs. And they continually call for more defense spending and wars as a way to create jobs. But the facts here again are the contrary. Increasingly, defense spending results in more high tech-high cost weapons systems that only boost still further the bloated profit margins of defense giants like Lockheed, Raytheon, Boeing and others, and actually result in more jobs outsourcing to these same companies foreign defense contractor partners in Japan, Germany, Israel, the United Kingdom and elsewhere.

The S&P-Fortune 500 largest corporations today sit on more than $2 trillion in cash and refuse to spend it to invest in America and create jobs here at home. The big tech-big bank-pharmaceutical companies sit on another cash hoard of more than another $1 trillion sheltered offshore and refuse to bring it home to create jobs. And the big 19 banks sit on still another $1 trillion and refuse to lend to small businesses to create jobs.

If big banks and big business refuse to use their bailed out $4 trillion cumulative cash hoard of the past three years to create jobs, then the government must tax it, must take it back from them and directly create jobs itself. The U.S. needs a 21st century version of the 1930s Depression-era New Deal jobs programs, adapted from the past to present conditions. What the U.S. economy needs is the immediate creation of a Civilian Conservation Corp (CCC) program similar to that created in 1933. In just 90 days the CCC created the equivalent of 1.2 million jobs in today’s economy. Intermediate and longer term, what the economy now needs is a new 21st century Works Progress Administration (WPA), that created between 1935-40 the equivalent today of 25 million jobs.

More specifically, the U.S. needs a new Alternative Energy Public Investment Corporation (AEPIC), in which the government would invest directly in alternative energy infrastructure. It needs a modern version of the 1930s CCC, a Civilian Reconstruction Corporation (CRC), to directly build, repair and maintain urban areas and urban renewal. It needs a Community Health Services Administration (CHSA), to build medical clinics in communities and provide direct health services to the working poor, those on Medicaid, and the 50 million uninsured. And it needs a 21st Century Works Progress Administration(21WPA), that targets job creation in non-infrastructure and non-health services employment across all other industries and occupations.

The $4 trillion to fund these direct job creation programs are there. There s no need to raise the deficit or debt. If the super-wealthy and their big corporations and banks wont spend the trillion dollar bailouts they were provided by the US taxpayer, to invest in America and create jobs, then the only alternative is for the government to reclaim those trillions and spend it on direct job creation programs itself.

Jack is the author of An Alternative Program for Economic Recovery, available at his website, http://www.kyklosproductions.com, and the forthcoming March 2012 book, Obamas Economy: Recovery for the Few, by Pluto Press and Palgrave-Macmillan.

COMMENTARY: On FRIDAY, JANUARY 27, 2012 THE US GOVERNMENT REPORTED RESULTS FOR THE GROWTH OF THE ECONOMY FOR THE FOURTH QUARTER OF 2011 AND ALL OF 2011. THE GROSS DOMESTIC PRODUCT STATISTIC, OR GDP, SHOWED THE ECONOMY GROWING AT A 2.8% ANNUAL RATE FOR OCTOBER-DECEMBER 2011. THAT REPRESENTED A RISE FROM THE AVERAGE OF ONLY 1.7% FOR THE ENTIRE PRECEDING NINE MONTHS OF 2011. THE PRESS HAS BEGUN HYPING THE 2.8% NUMBER AS INDICATING AN ACCELERATING GROWTH OF THE US ECONOMY AND THUS A RECOVERY UNDERWAY. BUT A CLOSER LOOK AT THE FOURTH QUARTER GDP STATISTICS SHOW THE GROWTH WAS REALLY ONLY AROUND 1-1.2%, THAT IS ABOUT WHAT IT HAD BEEN FOR THE PRECEDING NINE MONTHS. HERE’S WHY.

‘A Comment on GDP and Other Year-End Statistics’ by Jack Rasmus, copyright 2012

On Friday, January 27, 2012 the first advanced reporting of fourth quarter 2011 GDP statistics were released. It showed a first estimate of GDP growth of 2.8%. That follows a third quarter GDP number of 1.3%, and a first half 2011 of only 0.8%. At first glance it would appear economic growth is on the rise, supporting the claims of politicos and pundits that recovery is on the way (once again). But a closer look shows the US economy still remains mired in a stagnate, little to no growth condition.

A normal historical growth rate for the US economy is about 2.5%. But that’s a long run average pre-2007. That long run 2.5% average is well below what is normal for a recovery from a recession at our current stage two years after 2009. At our current stage in past recession recoveries, the GDP growth rate is normally 4% to 5%. For the entire last year of 2011, actual GDP rose only 1.7%. That’s easily less than half the normal at this stage for a recession recovery.

But even that 1.7% average for all of 2011 assumes the official 2.8% last quarter was really 2.8%. It wasn’t. Last quarters 2.8% was really around the same 1.0% rate that marked the first nine months of last year, 2011. Heres two reasons why:

To begin with, the fourth quarter 2.8% number will likely be revised downward to 2.7 or even 2.6% in the next two revisions that typically follow the reporting of advance first estimates of GDP reported on January 27. But lets not even count that reduction yet. Lets start from the reported 2.8%.

The first problem with the fourth quarter estimate of 2.8% is that 1.9% of that total was due totally to business inventory buildup in the fourth quarter (which means it wont last going into 2012). In the preceding third quarter 2011, inventory building by business collapsed to almost zero. The 1.9% therefore reflects recovery of the inventory buildup that didn’t occur in the third quarter 2011 but got put off to the fourth quarter. So the 1.9% for fourth quarter 2011 inventory buildup was really about half that, or only around 1%. That means 1% should be deducted from the total 2.8% GDP growth in the fourth quarter. And in turn that means GDP really grew only by 1.8% in the fourth quarter, not by 2.8%.

Here’s where the second problem comes in. The 2.8% is what is called real GDP. That is, GDP that is adjusted for price inflation. The specific price index that is used to adjust for inflation for GDP is called the GDP deflator. If that deflator reports a very low inflation rate, the real GDP growth is higher. The GDP deflator claimed that inflation in the fourth quarter of 2011 was only a mere 0.4%. Does anyone believe that? The true inflation rate for the fourth quarter has to have been at minimum at least 1%. That’s 0.6% higher than the 0.4% that was officially reported by the GDP deflator. That 0.6% higher should therefore be subtracted from our adjusted 1.8% GDP growth rate in the fourth quarter. The real real GDP should therefore be around 1.2%–that is, just about the 1% rate of GDP growth that occurred throughout all of last year.

In short, the US economy remained stuck in its stagnant, no-to-low growth condition in the fourth quarter that characterized the US economy throughout all of 2011.

There are a host of other problems with government statistics for the fourth quarter as well. Another area of problem is reporting on jobs. Its important to know that the 200,000 job growth reported by the labor department was not the true, actual number of actual jobs created. The 200,000 is a statistic; that is, a manipulation of the actual raw, true jobs data that is then adjusted for seasonality assumptions by the labor department, new business formation assumptions, and other operations on the data. These adjustments typically tend to boost the real job numbers during the year end holiday season higher than the actual. The labor departments seasonal and other adjustments were more accurate before 2007, but are now significantly less so in the current recession and stagnant recovery that makes the present economic downturn unique.
As just one example with regard to jobs: the seasonal adjustment for December 2011 reported 42,000 hires of couriers and messengers. These are workers hired by UPS, Fedex, etc. to accommodate temporary surges in parcel mailings. These are temp workers that then are typically laid off after the holidays. But the 42,000 reported was actually 86,000 messengers and couriers, most of whom will be laid off soon in 2012. Another related problem is the seasonal adjustment of workers hired in retail, another temp-part time surge in the holiday season. The labor department gross under-reported those numbers as well. Those workers too will be laid off in huge numbers come the first quarter of 2012.

Another deeper look at what really happened to retail sales in November-December is also revealing. Despite the hype around a record holiday season, the facts now coming out in January show that retail sales, year over year, rose only 0.1% in December, and most of that due to car sales. Minus auto sales, retail sales declined in December 2011 compared to the year earlier, the first such fall since May 2010. And that despite record price discounting by retail sales companies. Even that poor retail sales performance was driven by rising use of credit cards once again by consumers, or by their dipping into savings for holiday spending. The latter was not surprising, given that wages and salaries rose only 1.8% (and most of that at the high end) while prices rose double that at 3.5%. In other words, real wages and income continued to fall, as they have since 2009. Over the past decade household income has declined has been about 10%. No wonder holiday sales were so poor, given the continuing decline in real wages and household income for the bottom 90%.

To sum up, fourth quarter GDP was really much less than reported. The first quarter 2012 will be little different than 2011and even possibly much worse should the Eurozone almost certainly experience a severe banking crisis this year. The real outlook for the US economy (not the politic-pundit version) and the real problems in the Eurozone and slowing global economy elsewhere is why the Federal Reserve a few days ago also indicated it planned to keep interest rates at zero for an additional two years, through 2014, instead of early 2013. It knew the public reporting on the economy for December and fourth quarter was really not all that rosy. The Fed knows the US economy will most likely get weaker, not stronger, in 2013 and perhaps even sooner. It knows that US banks will have to be bailed out again if European banks tank this summer. And if that happens it means a double dip recession this writer has been predicting for no later than early 2013.

Jack Rasmus

Jack is the author of An Alternative Program for Economic Recovery, October 2011, available on his website, http://www.kyklosproductions.com; and the forthcoming March 2012 book, Obamas Economy: Recovery for the Few, Pluto press and Palgrave-Macmillan.

COMMENTARY: Earlier this past week President Obama gave his State of the Union (SOTU)address to Congress. He sounded more like someone in 2008 wanting to be president rather than someone the past three years who in fact was president. You know, ‘talk the talk’ and sound progressive before election, and thereafter forget about ‘walk the talk’. As part of his speech he emphasized the need for finally creating jobs. But he clearly focused on manufacturing as the main engine of job creation going forward. What follows is some deep fact-checking on what the record of manufacturing and job creation has been and why his call for ‘let’s boost manufacturing and exports’ as the key to jobs recovery is just a sham job creation program, taken straight out of the economic playbooks of the president’s corporate advisers, the Bill Daleys and Jeff Immelts. Subsequent commentaries on the Obama SOTU 2012 speech–on taxes, medicare, education, and housing–will follow this first entry on jobs.

“Fact Checking Obama’s State of the Union Speech, Part 1 (Jobs)” by Jack Rasmus, copyright January 2012

Last Monday, January 24, 2012 President Obama delivered his latest State of the Union (SOU) speech to Congress. It heavily emphasized economic themes, among which were jobs, manufacturing, trade, the auto industry, teachers, taxes, medicare, financial regulation, and growing income inequality in the U.S. Claims were made and general proposals offered for creating more jobs and how to get a sluggish US economic recovery finally going after three years of tepid, stop-go results. But many of the Presidents claims in his SOTU speech were contrary to the facts, especially with regard to jobs. And the proposals he reaffirmed for generating a sustained economic recovery were more of the same old wine in new bottles that haven’t had much impact to date. Here’s some facts concerning jobs to consider before feeling too optimistic over what was largely a campaign election year SOTU speech–a speech more reminiscent of Obamas 2008 talk the talk period than his 2009-11 talk but no walk record.

Part 1: JOBS

Obama boasted that the US manufacturing sector had turned around and created millions of jobs on his watch. He subsequently raised the need to further boost manufacturing and the exports of US manufactured goods as one of his two primary recommendations for doing something about the 23 million jobless still without work in the U.S. (The other primary recommendation was more business tax cuts, about which will follow in Part 2).

What are the facts concerning manufacturing sector jobs in the U.S. today?

According to the US Labor Department (table B-1 Employment Reports), there were 17.264 million jobs in manufacturing in December 2000. By the start of the recession in December 2007 there were 13.879 million. When Obama took office in 2009 there were 13.406 million. As of December 2011 there were 11.812 million.

Over the past year, from December 2010 through December 2011 there were 1.932 million total private sector jobs created. But only .218 million of those were manufacturing jobs. And virtually all of those manufacturing jobs were created in the first half of 2011, as global trade and exports accelerated. That same global trade began contracting in the second half of 2011. In response to that contraction, in the last three months of 2011, October-December, US manufacturing employment actually fell by 24,000 jobs. So tell me how this picture, and a further promotion of manufacturing sector is going to significantly reduce the 23-24 million currently still jobless in the US? Even at the early 2011 rate, it will take 100 years to create 20 million additional manufacturing jobs.

The above numbers represent total manufacturing jobs. How about jobs for non-supervisor/non-managers in manufacturing? Since the so-called official end of the recession in June 2009, through December 2011over a period of two and a half years–a mere 174,000 production manufacturing jobs were created. That’s a meager 5,800 a month.

The president in his speech was exceptionally laudatory of the US auto companies, praising all three for having fully recovered and now creating jobs. But lets look at the record here as well. 315,000 auto jobs were lost from the start of the recession in December 2007 through the end of 2010. Over the past year the industry has hired back at the rate of only 4,000 a month, or 48,000, of those 315,000 jobs lost. And lets not forget, the overwhelming number of those hired the past year have been temp status auto industry jobs paid at around $14 an hour, about half of the normal auto worker wage rate. Yes, the auto companies are hiring, but at half pay. Not surprisingly, their profits have recovered, but have done so by shifting money from auto workers to auto companies profits bottom line.

Ok, friends of the administration may argue, maybe the facts regarding manufacturing jobs were a bit overblown, and exaggerated by the president. What about the 1.9 million total private jobs created this past year. Isn’t that significant? Well, 600,000 of those jobs were created in the retail sector in the last two months of 2011, the holiday season. Most jobs in that sector are part time and temp jobs, many of which will soon disappear in early 2012. Another 82,000 jobs were messengers and couriers, hired by UPS, Fedex, etc. for the surge in mailing in the holiday season. They too will quickly disappear in early 2012. In addition, Banking and Finance sector companies have announced more than 150,000 layoffs scheduled for 2012, and that’s just a start. And the two biggest job creation sectors of the economy in the first half of 2011–Business and Professional Services and Leisure and Hospitality–both reduced jobs in the final two months of 2011 by 264,000 jobs.

Finally, lets not forget the non-private, government sector of the economy. While the private side may have created 1.9 million jobs, 257,000 state, local government, and postal workers lost their jobs just in 2011 alone, 106,000 of whom were teachers.

While on the topic of teachers, Obama praised the profession for its key role in the economy and development of society. He properly noted teachers should be honored and respected for their contribution to both. He then proclaimed the best teachers should be rewarded with more pay. Education managers should be given more flexibility, he advocated, to give more pay to the best teachers and get rid of the worst. This is his Education Secretary, Arne Duncan’s, old formula. In practice it means the introduction of merit pay, which would undermine teacher union contracts, and more manager freedom to fire teachers and/or layoff out of seniority based on administrator preferences and favoritism–the old civil service approach. Together with the push toward charter schools, Obama’s policy for education amounts to a destruction of teacher union contracts. Charter schools plus merit pay plus end of seniority and more freedom to fire means the end of teacher unionism as we know it.

In the second half of 2010 Obama reshuffled his staff, re-populating his team with corporate advisers. Bill Daley became chief of staff. General Electric Corp. CEO, Jeff Immelt, headed his jobs council. Scores of corporate underlings were hired behind them. What we subsequently got in terms of jobs policy was a manufacturing sector-export trade centric set of proposals. Jobs were supposed to come from stimulating manufacturing, exports, pushing free trade, as well as cutting business regulations, promoting patent protection for the tech sector, and similar pro-business approaches. Daley-Immelt essentially took over the Obama jobs program.

More business and investor tax cuts followed, including $802 billion in further tax reductions in December 2010. Regulations were reduced, as Obama bragged in his SOU that he cut more regulations than did George W. Bush in his first term. Contrary to his 2008 campaign promises to restructure job-killing free trade agreements, the Obama-Daley-Immelt team opened a new offensive to pass pending free trade agreements with Korea, Panama, Columbia and elsewhere. The former three were adopted in 2011. These were promoted as manufacturing job-creation measures. However, according to various studies since 1994 by the respected Economic Policy Institute, more than 10 million jobs have been LOST due to free trade. Nevertheless, in his SOU speech Obama once again is promoting the corporate line and false claim that free trade creates jobs.

Manufacturing output has risen significantly since mid-2009, as has manufacturing corporations’ revenues and profits, especially the big multinational players like Immelt’s GE and the auto and high tech companies. But manufacturing jobs are still 1.6 million short of where they were in early 2009 and wages of new manufacturing jobs are far lower than existing wages. A few workers get low paying jobs, while manufacturing companies reap the big benefits of Obama’s manufacturing-export centric jobs policies. The ‘lets boost manufacturing-export companies’ approach to job creation has been a sham job creation program, taken straight out of the economic playbook of the Daleys and Immelts that have been driving the Obama team jobs program since late 2010. And by the comments of President Obama in his recent SOTU address, corporations will continue to drive the Obama jobs program, while they simultaneously sit on their current $2.5 trillion cash hoard and refuse to invest in America. Sure, GE and GM will create some jobs in America, so long as workers are willing to work for Chinese wages!

Jack Rasmus

Jack is the author of EPIC RECESSION: PRELUDE TO GLOBAL DEPRESSION, 2010, by Palgrave-Pluto press and the pamphlet, Alternative Program for Economic Recovery, Kyklos Productions, October 2011, which may be purchased from his website, http://www.kyklosproductions.com.

COMMENTARY: MY PRECEDING BLOG POST, ‘ECONOMIC PREDICTIONS 2012-13’, SUMMARIZED THIS WRITER’S ANNUAL PREDICTIONS FOR THE U.S. AND GLOBAL ECONOMIES FOR THE YEAR AHEAD. THE 13 PREDICTIONS ARE PUBLISHED IN THE JANUARY 2012 ISSUE OF ‘Z’ MAGAZINE. THE ‘Z’ PUBLICATION ALSO INCLUDES ADDITIONAL MATERIAL EXPLAINING WHY MAINSTREAM ECONOMISTS HAVE HABITUALLY MISSED THE MAJOR TURNING POINTS OF THE US-GLOBAL ECONOMY IN RECENT YEARS–INCLUDING THEIR FAILURE TO PREDICT THE EPIC RECESSION OF 2008, THEIR ERRONEOUS PREDICTION OF A RAPID, ‘V’-SHAPE RECOVERY IN 2009-10, AND NOW THEIR FAILURE TO FORESEE WHAT’S COMING IN THE EUROZONE, CHINA, AND EMERGING MARKETS. THAT ADDITIONAL MATERIAL IN THE ‘Z’ ARTICLE IS NOW ALSO OFFERED HERE, AS A ‘PREFIX’ TO THE 13 PREDICTIONS PREVIOUSLY POSTED. THE MATERIAL THAT FOLLOWS ALSO INCLUDES A DATA TABLE NOT PUBLISHED IN THE ‘Z’ ARTICLE, SUMMARIZING THE OBAMA ADMINISTRATION’S TOTAL SPENDING AND TAX CUTS SINCE FEBRUARY 2009 THROUGH PROPOSALS OF LATE 2011.

‘Why Mainstream Economists Fail to Predict the Decisive Economic Turning Points’ by Jack Rasmus, copyright 2011

For the past two years this writer has written on the status of the US and global economy in the January issue of Z magazine, with predictions for the year to come and beyond. Past predictions since late 2009 have included: the Euro financial system will be shaken in 2010 by one or more defaults on its periphery; should Democrats lose further seats in the House (in 2010), a highly likely event, federal spending will almost certainly be further reduced in 2011; the Eurozone debt crisis will spread beyond the current four economies (Ireland, Portugal, Spain, Greece) and engulf Italy, Belgium, and potentially France; home prices will fall another 10% to 15% in the US (and)foreclosures will rise past 10 million; states, cities, and school districts will turn to massive layoffs; the job gains this spring (2011) will once again likely disappear in the coming summer-fall 2011; both Japan and the Eurozone economies will weaken faster than the U.S.a restructuring of the EU currency system will result in a kind of two-tier euro currency

Predicting the trajectory of the US and global economy in these volatile economic times is an uncertain endeavor. But that’s the very time predictions are of most value. Unfortunately, with a handful of exceptions, the mainstream economics profession habitually focuses on predicting the present rather than the future. That statement is not as contradictory as it seems. Translated, it means mainstream economics assiduously avoids predicting beyond the next few weeks or, at most, the next monthly release of data. Forecasting fundamental turning points of the economy, and the major events that provoke major crises, are avoided at all costs. It is far safer to find refuge in conservative consensus opinion than to risk stepping outside it. After all, if the consensus is wrong, one cant be individually faulted by ones professional peers if the vast majority of those peers are also in error! However, this conservative bias contributes little toward understanding the most likely trajectory of conditions and events as the economic crisis continues to evolve and unfold.

Mainstream Economics: A Bird Without Wings

Seeking refuge in conservative consensus partly explains why virtually all the 10,000 professional economists in the world failed to predict the onset of the current crisis in 2007. Or why the same crew, in lock-step, declared a sustained economic recovery after 2009 would occur but didn’t. It is also why the same group today are failing, for yet a third time now, to foresee the coming deeper economic crisis that will almost certainly emerge no later than early 2013and potentially even earlier if the Eurozone financial system continues to unravel this spring 2012.

The repeated failure of the profession to predict the three great economic events of the past four years (two having occurred; one emerging) is not simply the consequence of economists myopic fixation on the latest data release or their consistent conservative bias, but more fundamentally is the result of their adherence to a conceptual apparatus that cannot explain the essential forces behind the current crisis. It is the result of theories based on pre-crisis conditions that no longer prevail; and of models that simply no longer work.

Deficient concepts, theories and models are why Obama’s own in-house professional economists–the Council of Economic Advisers–in early January 2009 erroneously assured the public that Obama’s $787 billion initial stimulus package would create 6 million jobs. But it didn’t. They are why the Federal Reserves economists insisted the $2.7 trillion Quantitative Easing (QE) 1, 2, and 2.5 (called operation twist) policies introduced between 2009-11 would resurrect the housing sector, but instead only fed stock, junk bond, and commodities futures speculators worldwide. And they are why Congressional Budget Office economists forecast that Obama’s $802 billion tax cuts introduced a year ago, in December 2010, would result in a significant increase in GDP growth rates and jobs, but instead produced GDP growth of less than 1% in the first half of 2011 and no net job creation the entire past year. Something clearly is wrong with the theories and models, as well as the conceptual apparatus underlying those theories and models.

The Broken Left Wing: Just Give Us More Stimulus

The liberal wing of the flightless bird of mainstream economics continues to maintain that the Obama programs since 2009 have not produced sustained economic recovery because the 2009 economic stimulus was of insufficient magnitude. At the forefront of this view have been noted economists like Paul Krugman and others. Even Larry Summers, former Treasury Secretary under Clinton and chief economic policy adviser for Obama in 2009-10, has recently joined the liberal chorus saying that the original stimulus of 2009 should have been $1 trillion or more–not the $787 billion.

Contrary to this view, however, the Obama stimulus programs introduced 2009-10, which amounting to more than $1.7 trillion in tax cuts and spending, failed not simply because they were of insufficient magnitude. They failed because their composition was also exceptionally bad and their timing poor.

With regard to composition: the Obama stimulus programs were composed 70% of tax cuts–and mostly business tax cuts at that. The tax cuts were then hoarded by corporations and not invested in the US to create jobs. Nearly another half trillion dollars in Obama spending programs were composed of subsidies to states, school districts, and unemployed. Those subsidies were designed to buy time, put a floor under the collapse of consumption that was occurring in 2008-09, until the tax cuts could pick up the slack, translate into real investment, and move the economy to a higher level of recovery. But that didn’t happen. The tax cuts weren’t invested. At least not in the U.S. Some went offshore to create jobs in Asia and elsewhere. Other amounts went into purchasing speculative securities–stocks, derivatives, foreign currencies, etc., that also created no jobs. The remainder was retained, and is still being hoarded today, in anticipation of being spent on corporate stock buybacks, dividend payouts, or eventual mergers and acquisitions that will result in fewernot morejobs. Despite a tax stimulus of trillions of dollars, corporate America continues to sit on a $2 to $2.5 trillion cash hoard as of year end 2011. Multinational corporations continue to hoard another $1.4 trillion in offshore subsidiaries instead of investing and creating jobs in the US. Not to be outdone in the hoarding game, after having been bailed out with $9 trillion in free loans by the Federal Reserve, big banks continue to sit on another $1.7 trillion in excess reserves, doling out loans in eye-drop fashion to small business, resulting in still further under-investment and minimal job creation.

Meanwhile, Obama’s $370 billion dollars of subsidies dissipated after 12-18 months. Like business tax cuts, subsidies do not create jobs. They may temporarily save some. But that’s not economic recovery. Recovery means significant net job creation, typically in the range of 300,000 to 500,000 jobs every month for a year. Saving jobs is a policy of accepting continuing economic stagnation at best.

The remaining $126 billion dollars or so of Obama spending circa 2009-10 was earmarked for long term infrastructure–i.e. upgrading the national electrical grid, alternative energy projects, and so-called shovel-ready construction projects that couldn’t find their shovels. But that spending did not create jobs or generate recovery in the short run since 2009 any more than tax cuts and subsidies created jobs. Composed mostly of capital-intensive projects, most infrastructure spending was structured very long term, taking effect over a ten year period. Like the tax cuts, the short term effect of this infrastructure spending thus also resulted in little if any job creation or economic recovery.

This bad composition of the Obama stimulus programs (i.e. tax cut heavy, subsidies, and capital intensive construction) and their poor timing (i.e. ultra-long term infrastructure projects and one-time short term grants to the states) are represented in the following Table 1.

TABLE 1
Economic Recovery Programs
Tax Cuts vs. Spending / Subsidy vs. Infrastructure
2009-2011
(billions, current $)
Subsidy Infrastructure
Program Total Cost Tax Spending Spending Spending (long)

Obama I $862 $417 $445 $319 $126
(2/09 +
supplements)

Obama II $857 $803 $54 $54
(12/10)

Obama III $447 $253 $194 $89 $105
(9/11) ______ _____ _____ ______ ______

TOTALS $2,166 $1,473 $693 $452 $231

Source: Obamas Economy: Recovery for the Few, Pluto Press & Palgrave-Macmillan, March 2012.

Obamas three recovery programs to date failed because they relied on the private market sector to generate a sustained recovery, instead of on the government directly taking the lead to create jobs, rescue homeowners and resurrect housing, and stabilize state-local government finances long run. Obama bailed out banks that didnt lend, rescued corporations that didnt create jobs, and subsidized state and local governments for a brief period and then cut them loose to fend fiscally for themselves.

The Stunted Right Wing: Just Give Business More Profits

Radical Republicans subsequently took charge of the U.S. House of Representatives following the November 2010 midterm elections–and with it took over the economic policy agenda as well. The takeover created an ideal environment for the re-ascendance of the right wing of mainstream economics in the economic policy process. But if the left wing was broken and unable to clearly understand the reasons why the Obama recovery policies have failed, the right wing intellectually was a mere stub without feathers and thus even more incapable of flight.

The Obama programs failed to generate recovery, they argued, because they produced a lack of business confidence. That lack of confidence was due to business uncertainty about the future of tax cuts, to excessive business regulation, to stalled free trade agreements with South Korea, Panama, and Columbia, to excessive deficit pending and debt, to the excessive cost to business in the health care affordability act of 2010, and other such economic nonsense. Conservative economists argued that changing these policies would release more income for corporations and businesses to spend. More income would automatically translate into more investment and more jobs. The economy would then rapidly recover.

Whats conveniently ignored by this wing, however, are two major problems: First, massive government spending cuts and sharply reduced consumer incomes produces a steep decline in GDP and no recovery. Conservative economists argue this slack will be more than offset by a rise in business investment, which leads to the second problem: namely, with corporations already hoarding $2 trillion in cash and banks hoarding another $1.7 trillion in excess reserves today, why should giving corporations and banks even more cash and income result in investment and recovery? If corporations and the banks aren’t spending the $2 trillion or lending the $1.7 trillion they already have and insist on hoarding, why should giving them still more result in anything different? Exactly how many more trillions of dollars are needed to get them to invest, lend, and create jobs and ensure recovery?

This condition of mainstream economics today may be summarized with the following statement:

Just as the liberal wing of economics has no answer to exactly how much more magnitude of deficit spending is necessary to ensure a sustained economic recovery, the conservative wing cannot explain or answer how much more shifting of income to corporations and investors is needed to ensure a return to investment, jobs, and recovery.

Given such fundamental errors by both wings, it is not strange that both liberal or conservative economists today have had such great difficulty in recent years predicting the emergence and evolution of the current economic crisis. The bird simply cannot fly. It can only run around in circles, flightless, squawking as it turns first left and then right and back again.

With neither wing of the economics profession able to offer effective programs for economic recovery, what then are the likely scenario(s) for the U.S. and global economies in the year immediately ahead?

COMMENTARY: THIS PAST MONTH SEVERAL ECONOMIC INDICATORS HAVE FLASHED AN UPTURN OF THE US ECONOMY. MEDIA PUNDITS AND GOVERNMENT SOURCES HAVE JUMPED ON THESE NUMBERS TO HYPE A COMING RECOVERY–A SONG THEY’VE BEEN SINGING FOR THREE YEARS NOW. NOVEMBER JOBS, RETAIL SALES, AND TODAY’S HOUSING NUMBERS ARE REFERRED TO AS INDICATING THE RECOVERY (ONCE AGAIN) IS UNDERWAY. THIS VIEW IS VERY SHORT TERM AND MYOPIC, HOWEVER. FOR ONE THING, THE NUMBERS ARE HIGHLY QUESTIONABLE FOR NOVEMBER JOBS, DEBATABLE FOR RETAIL SALES, AND NOT ALL THAT SIGNIFICANT FOR HOUSING. ONE RECENT CRITIC OF MY LONGER TERM VIEW–FORECASTING A DOUBLE DIP IN LATE 2012-EARLY 2013 AT LATEST AND POSSIBLY EARLIER SHOULD THE EUROZONE CRISIS TURN FOR THE WORST IN 2012–HAS CHALLENGED MY LONGER TERM VIEW AND MY COROLLARY VIEW THAT WEEK TO WEEK AND MONTHLY DATA ARE NOT THE PROPER FOCUS FOR A FORECAST OF THE US ECONOMY 2012-13. HOWEVER, HE HAS RAISED AN IMPORTANT POINT WORTH DISCUSSING: IS THERE A RECOVERY NOW UNDERWAY BASED ON ONE MONTH’s QUESTIONABLE DATA? I STILL SAY NO. HERE’s WHY: THE PROBLEM WITH MAINSTREAM ECONOMISTS AND THEIR HYPING OF RECOVERY UNDERWAY YET AGAIN BASED ON LAST MONTH’S NUMBERS IS THAT THEY ARE MESMERIZED BY THE IMMEDIATE DATA AND CANNOT SEE THE BIGGER TURNING POINTS IN THE US AND GLOBAL ECONOMY THAT HAVE BEEN THE PRIMARY DRIVERS SINCE 2007. BASED ALMOST EXCLUSIVELY ON SHORT TERM DATA THAT IS OFTEN VOLATILE, THEIR MODELS FOR PREDICTING THE US AND GLOBAL ECONOMIES DIRECTION ARE DEFICIENT. THAT SHORT TERM FOCUS ON OFTEN QUESTIONABLE, AND CERTAINLY INTERPRETABLE, DATA IS WHY THEY HAVE FAILED TO FORECAST THE 2007-08 CRASH, WHY THEY THEN ERRONEOUSLY FORECAST RAPID RECOVERY OF THE US AND GLOBAL ECONOMY AFTER 2009, AND WHY TODAY THEY CANNOT SEE WHAT IS COMING IN 2012-13. THE FOLLOWING IS MY BRIEF REPLY TO ONE OF THEIR DEFENDERS OF THE OFFICIAL SHORT TERM ECONOMICS VIEW, WHO HAS POSTED HIS OPINION TO THIS BLOG AND OPENED AN IMPORTANT POINT OF DISCUSSION. I RESPECTFULLY DISAGREE WITH HIS DEFENSE OF WHAT HE CALLS THE “DEAN BAKER” VIEW–i.e. THE VIEW THAT ECONOMIC RECOVERY IS UNDERWAY AND MY FORECAST OF DOUBLE DIP IN 2012-13 IS INCORRECT. (NOTE: IN EARLY JANUARY I WILL BE POSTING TO THIS BLOG A MORE IN DEPTH ANALYSIS WHY THE US ECONOMY WILL SLOW ONCE AGAIN IN THE FIRST HALF OF 2012).

A REPLY TO A CRITIQUE OF MY FORECAST, by Jack Rasmus

Once again you, and Baker, are looking at short term economic indicators. You are forecasting the present, and not the future. You are no doubt referring to the questionable data on employment last month and today’s hyped housing numbers. Job numbers for the past six months are averaging less than 100,000. Last month’s 120,000 were 40,000 retail Xmas jobs–virtually all part time and temp that will disappear next January. The housing numbers are apartments building and are in response to what looks increasingly like a QE3 coming next spring, that will drop mortgage rates closer to 3%, that builders are now planning to take advantage of. They will build while it is cheap and wait to sell the inventory. Retail sales numbers recently are driven by banks issuance of credit cards once again and a drop in the household savings rate. These cannot and will not continue. Look at the longer picture: first, the Eurozone is headed into a deep recession. Most of it is already there. China is contracting sharply, heading for a hard landing; so is India, Brazil and other sectors of the global economy. That means global manufacturing is in for a contraction, which may be already underway, and that sector of the US economy will perform poorly next year. As for consumption, household real income declined by nearly 4% last year and more of the same is coming this year. The government sector will continue to contract in 2012, especially state and local. The problem with guys like you and Baker is that you cannot see beyond 2-4 weeks and you are mesmerized by the immediate data. You cannot forecast the turning points in the US and global economy with your limited models. The big picture your data does not factor in is a rapidly slowing global economy, Eurozone crisis and global contraction of bank lending, continual downward pressure on US household income (which ultimately determines consumption), and continuing deficit cutting and government spending contraction. When I predict a double dip, it has always been in the time-frame of late 2012-early 2013, or earlier if the Eurozone and or China contractions emerge significantly more severe by mid-year 2012.  So, address those arguments if you wish, and not the day’s latest (often questionable) numbers. It’s that kind of short-term view that makes guys like you miss the 2007-08 crash, erroneously predict rapid recovery after 2009, and now fail to see what is coming further down the road.